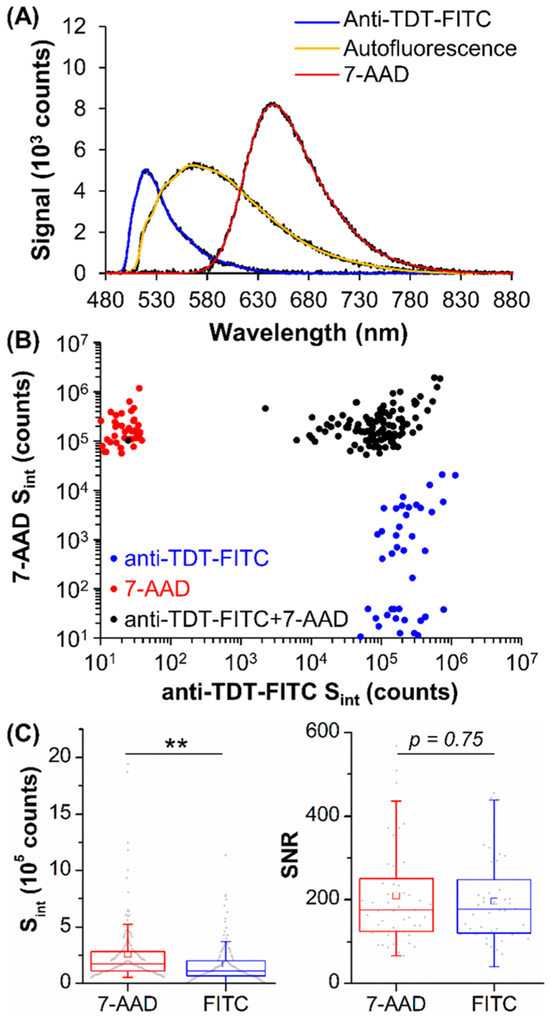
Figure 7.
(A) Integrated spectra of unstained (autofluorescence) SUP-B15 cells or cells stained with anti-TdT-FITC or 7-AAD. Fit curves (color lines) are overlaid on data (black lines). (B) Multiplexed unmixing of SUP-B15 cells stained with anti-TdT-FITC only, 7-AAD only (model B-cells), or both markers (model CLCs). Data without signal was expanded near the axis for illustration purposes only. (C) Box plots of Sint and SNR for 7-AAD and anti-TdT-FITC staining. Statistical analysis showed p < 10−4 (**).

