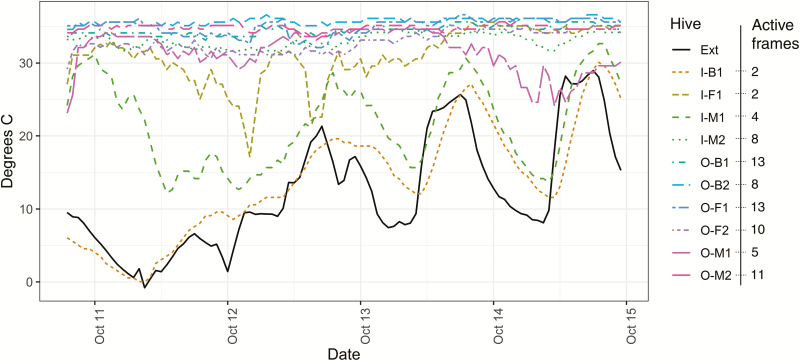
Fig. 3.
Internal temperature of hives and number of colonized frames during transportation from North Dakota to California. Hive temperature during transportation was recorded hourly. Orientation (I, O) of hives is indicated by ‘I’ for hives facing the central aisle and ‘O’ for hives facing outward. Position (F, M, B) indicates front, middle, or back location of hives on the trailer. The number of actively colonized frames is indicated for each hive. External temperature is shown in black. Hive orientation had a significant effect on thermoregulation, with hives facing inward more likely to lose thermoregulation (F = 10.523, P = 0.023). Colony size at departure, indicated as the number of active frames, did not significantly affect thermoregulation (F = 4.266, P = 0.094) nor did hive location (F = 0.024, P = 0.976).

