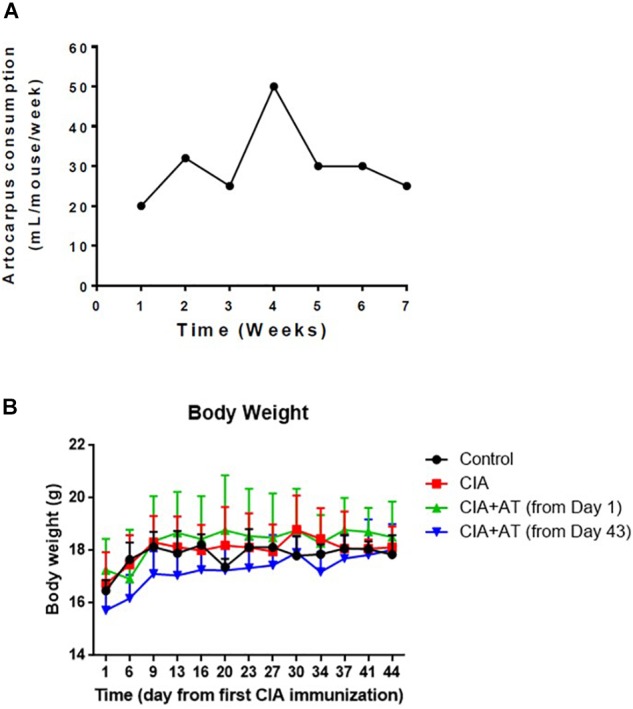
FIGURE 2.

Artocarpus tonkinensis decoction consumption and body weight. (A) Amount of A. tonkinensis decoction (mL/mouse, y-axis) consumed by mice during the course of experiment (weeks, x-axis). (B) Body weight (g) of mice in groups drinking water (Control), immunized and drinking water (CIA), immunized and drinking At decoction from day 1 [CIA + At (from day 1)], and immunized and drinking At decoction from day 43 [CIA + At (from day 43)].
