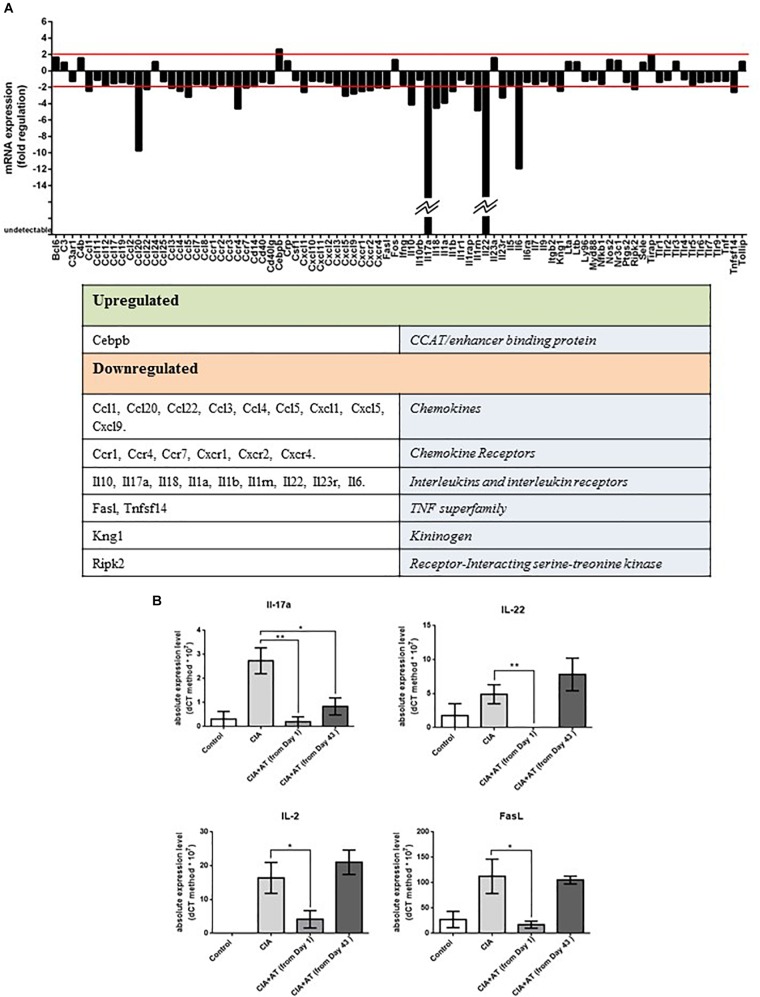
FIGURE 4.
(A) Autoimmune gene expression profiles. Genes related to autoimmune responses significantly up- or downregulated by At decoction are shown. Analysis was performed on RNA extracted from 2 CIA mice drinking water and 2 CIA mice drinking At decoction. (B) Real-time PCR of targeted autoimmune-related genes from mouse lymph nodes. RNA extracted from lymph nodes of mice in the groups drinking water (Control), immunized and drinking water (CIA), immunized and drinking At decoction from day 1 [CIA + At (from day 1)], and immunized and drinking At decoction from day 43 [CIA + At (from day 43)] was template for real-time PCR of IL-17 (upper left), IL-22 (Upper right), IL-2 (lower left) and FasL (lower right). Bars represent values ± 1 SEM from three independent experiments. Statistical analysis was performed with a Student’s t-test: ∗∗p ≤ 0.01; ∗p ≤ 0.05.

