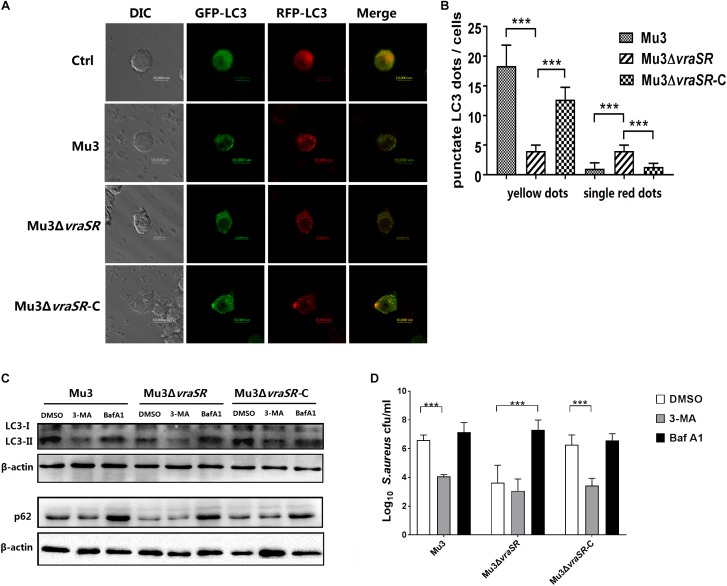
FIGURE 5.
The VraSR regulatory system is involved in autophagic flux inhibition in S. aureus-infected cells. (A) RAW264.7 cells stably expressing mRFP-GFP-LC3 were infected with Mu3, Mu3ΔvraSR, or Mu3ΔvraSR-C for 3 h. Representative differential interference contrast (DIC) and corresponding GFP and RFP fluorescence images are shown. Bars, 10 μm. (B) Quantitative measurement of autophagic flux. The number of punctate dots was enumerated in at least 100 cells at 3 hpi. The X-axis represents the average number of puncta/cell. The data are presented as the mean ± SD. The SD was calculated from experiments performed in triplicate (n = 3). Statistical significance was determined by one-way ANOVA with Bonferroni posttest. (C) RAW264.7 cells were pretreated with 3-MA or Baf A1 for 2 h before being infected with S. aureus for 3 h. Cells were then lysed to examine LC3 and p62 protein levels by western blot. β-actin are used as the loading control. Gels were representative of three independent experiments (n = 3). (D) Quantification of intracellular bacteria in RAW264.7 cells infected with S. aureus for 6 h in the presence or absence of 3-MA or Baf A1. The X-axis represents different strains and the Y-axis represents log10 CFU/ml S. aureus. The data are presented as the mean ± SD. The SD was calculated from experiments performed in triplicate (n = 3). Statistical significance was determined by one-way ANOVA with Bonferroni posttest. ∗∗∗P < 0.01.

