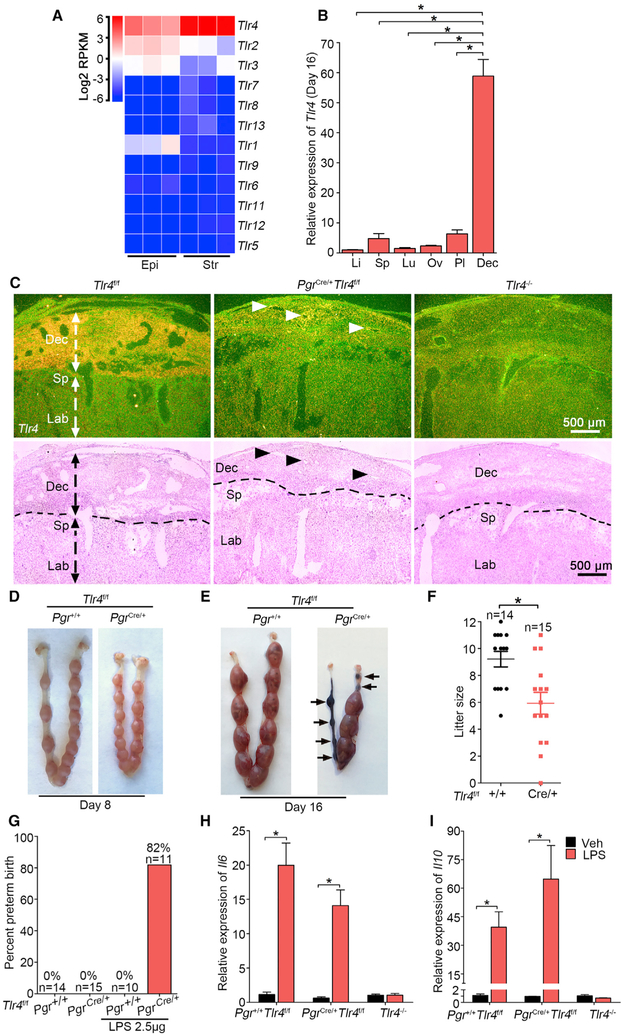
Figure 1. TLR4 Is Beneficial during Normal Pregnancy.
(A) Heatmap of RNA-seq analysis of Tlr mRNAs (log2 RPKM) in separated epithelial (Epi) and stromal cells (Str) from day 4 pregnant uteri (n = 3). RPKM, reads per kilobase per million.
(B) Relative Tlr4 expression levels in various organs in day 16 pregnant Tlr4f/f mice by qPCR. rpL7 was used as internal controls. Li, liver; Sp, spleen; Lu, lung; Ov, ovary; Pl, placenta; Dec, decidua; n = 4, *p < 0.05. Data are represented as mean ± SEM.
(C) Dark-field and bright-field images of in situ hybridization for Tlr4 in Tlr4f/f, PgrCre/+Tlr4f/f, and Tlr4 genomic knockout (Tlr4−/−) mice. Arrow heads indicate remaining Tlr4 in PgrCre/+Tlr4f/f mice. Dotted lines demarcate the interface between maternal decidua and spongiotrophoblast. Dec, decidua; Sp, spongiotrophoblast; Lb, labyrinth. Scale bar, 500 μm.
(D and E) Days 8 (D) and 16 (E) implantation sites in Tlr4f/f and PgrCre/+Tlr4f/f mice. Arrows indicate resorption sites.
(F) Live litter size in Tlr4f/f and PgrCre/+Tlr4f/f mice. n, animal number in each group, *p < 0.05. Data are represented as mean ± SEM.
(G) The ratio of preterm birth to total number of pups per gestation in Tlr4f/f and PgrCre/+Tlr4f/f mice with or without exposure to a low dose LPS (2.5 μg/mouse). n indicates the number of total mice examined in each group.
(H and I) qPCR of Il6 (H) and Il10 (I) mRNA levels in Tlr4f/f, PgrCre/+Tlr4f/f, and Tlr4−/− mice after 1 h of LPS treatment. *p < 0.05. Data are represented as mean ± SEM (n = 4).
See also Figure S1.

