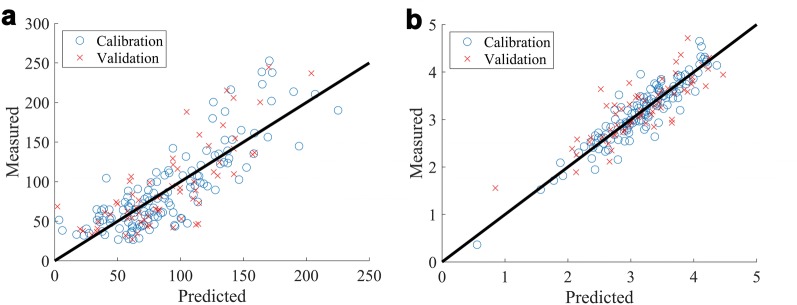
Fig. 3.
a Validated model performance for total sugars expressed as mg/g for the 2016 trial (BL + PS HSI reflectance spectra analysed by PLSR (SNV) model; Validation R2 = 0.58, n = 66, LV = 12, RMSE = 34.4 mg/g, intercept = 10.1 ± 9.6 mg/g, slope = 0.93 ± 0.10, bias = − 3.8 mg/g). b Validated model performance for Nitrogen % for the 2016 trial (BL + PS HSI mean reflectance spectra analyzed by PLSR (SNV) model; Validation R2 = 0.70, RMSE = 0.35%, n = 64)

