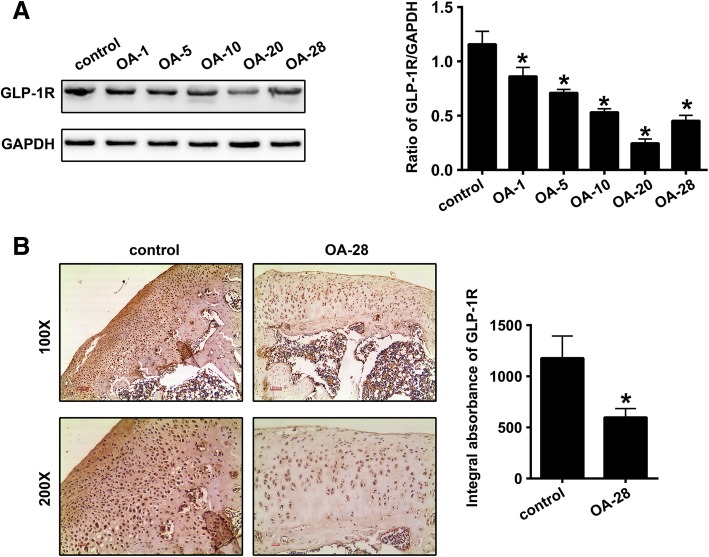
Fig. 1.
Decreased expression of GLP-1R in the cartilage tissues of a knee OA rat model. a Representative Western blots and quantification data of GLP-1R expression levels in control, OA-1, OA-5, OA-10, OA-20 and OA-28 groups (n = 5 per group). b Representative images (100 × and 200×) of immunohistochemical (IHC) staining and corresponding quantification of GLP-1R expression levels in the control and OA-28 groups (n = 5 per group). * indicates P < 0.05 compared with the control group

