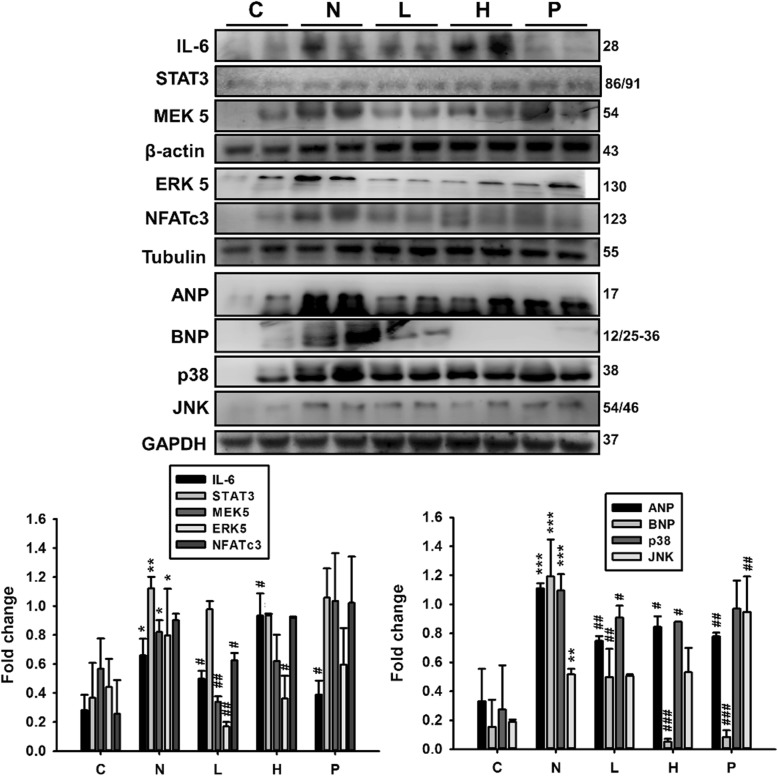
Fig. 4.
Effects of GT extracts on hypertrophy marker proteins in STZ-NA-induced changes in rat liver tissues. The levels of hypertrophy proteins IL-6, STAT3, MEK5, ERK5, NFATc3, p-p38 and p-JNK in the control rats, STZ-NA rats, and treatment group rats are shown. Data (n = 6) represent the mean ± SEM. *p < 0.05, **p < 0.01, ***p < 0.001 compared with the C group; #P < 0.05, ##P < 0.01 and ###P < 0.001 when compared with the N group. C: control; N: STZ-NA + HFD; L: Glossogyne tenuifolia low dose (50 mg/kg); H: Glossogyne tenuifolia high dose (150 mg/kg); P: acarbose (positive control)

