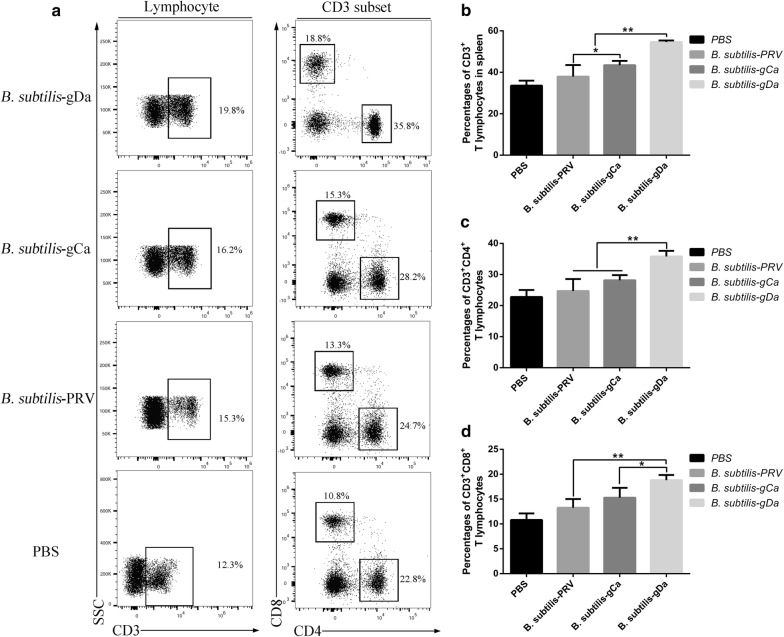
Fig. 3.
The percentage of CD3+, CD3+CD4+, and CD3+CD8+ T lymphocytes in spleen. The spleen was separated from the mice at 35 day. a The representative flow cytometry plots showing CD3+, CD3+CD4+, and CD3+CD8+ T lymphocytes in the spleen. The quantification of the frequencies were shown in b CD3+, c CD3+CD4+ and d CD3+CD8+ T cells. Data were expressed as the mean ± SD. * P < 0.05, ** P < 0.01

