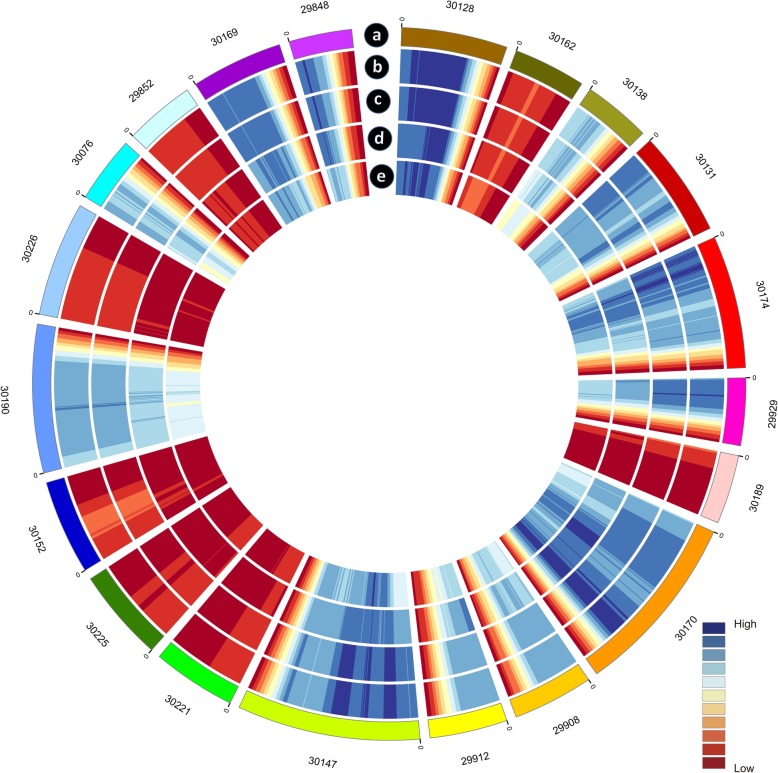
Fig. 2.
CIRCOS visualization of gene and transcript density compared PacBio SMRT sequences with Ricinus communis reference genome for 20 top lengths of scaffolds. a Twenty longest scaffolds schematic. b Heat map of gene density distribution of PacBio SMRT sequences. Gene density was calculated in a 1-Mb sliding window at 20 kb intervals. c Heat map of transcripts density distribution of PacBio SMRT sequences. Gene density was calculated in a 1-Mb sliding window at 20 kb intervals. d Heat map of gene density distribution of the reference genome. Gene density was calculated in a 1-Mb sliding window at 20 kb intervals. e Heat map of transcripts density distribution of the reference genome. Gene density was calculated in a 1-Mb sliding window at 20 kb intervals

