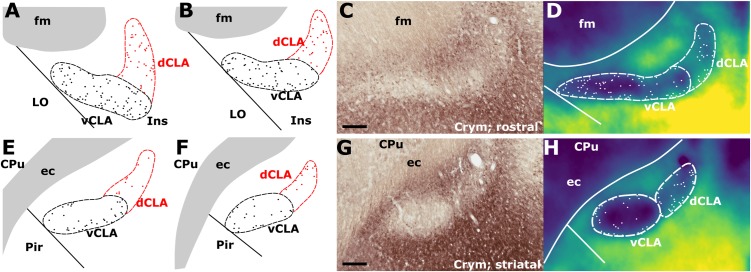
FIGURE 4.
(A,B) Schematic representations of crystallin mu (Crym) delineated boundaries of the claustrum anterior to the striatum (CPu), highlighting the density of ectopic Crym-positive cell soma within the ventral (vCLA; black) and dorsal claustrum (dCLA; red). (C) shows representative Crym staining in the claustrum/insular while (D) shows a pixel density heat map of (C) highlighting 1. The difficulty associated with determining the boundary between vCLA and dCLA; and 2. Cortical fibers crossing the claustrum to join the internal capsule. (E–H) show equivalent panels from striatal levels in which the number of ectopic Crym-positive cell soma is reduced and the boundary between vCLA and dCLA is more distinct. ec, external capsule; fm, forceps minor of the corpus callosum. Scale bars = 200 μm.

