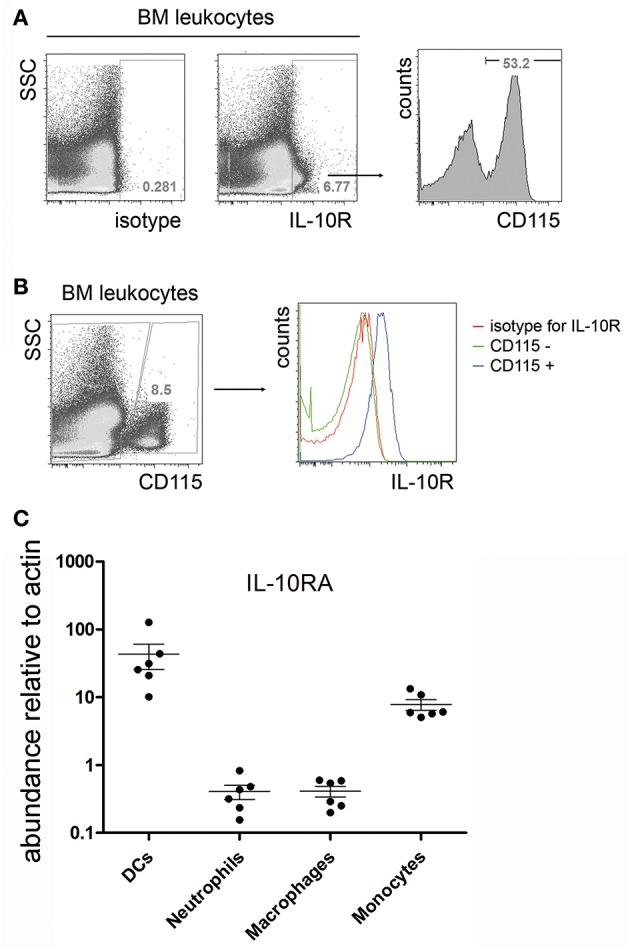
Figure 2.

IL-10R expression in the bone marrow. Single cell suspensions from femurs and tibia of C57BL/6 mice were stained for IL-10R and CD115. (A) Representative flow cytometric staining for IL-10R compared to an isotype control (left). IL-10R+ cells were electronically gated and analyzed for the expression of CD115 (right). (B) IL-10R expression on gated CD115+ bone marrow monocytes. CD3+, B220+, and Gr-1+ cells were excluded from the analysis by electronic gating. Data represents results obtained from one of two independent experiments (n = 7). (C) Bone marrow dendritic cells (CD115+ Ly6C− CD11c+), neutrophils (CD115− Ly6C− CD11b+ Ly6G+), macrophages (CD115− CD11c− F4/80+), and monocytes (CD115+ Ly6C+ CD11c−) were sorted by FACS and IL-10RA expression was determined by real time PCR. Relative il10ra mRNA levels compared to actin are shown. Pooled data from two independent experiments are shown (n = 6).
