Figure 3.

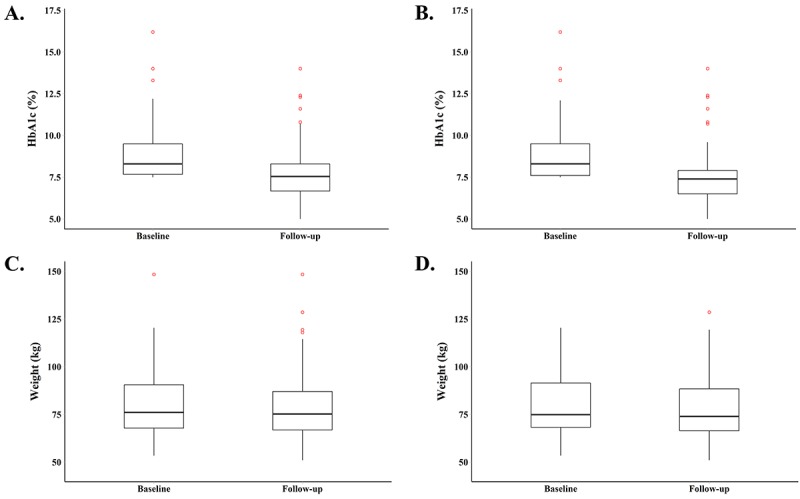
Distributions of health outcomes at baseline and follow-up: (A) HbA1c for total sample (n=100), (B) HbA1c for completes (n=83), (C) weight for total sample (n=100), and (D) weight for completes (n=83).

Distributions of health outcomes at baseline and follow-up: (A) HbA1c for total sample (n=100), (B) HbA1c for completes (n=83), (C) weight for total sample (n=100), and (D) weight for completes (n=83).