Abstract
Super-resolution microscopy (SRM) has had a substantial impact on the biological sciences due to its ability to observe tiny objects less than 200 nm in size. Stimulated emission depletion (STED) microscopy represents a major category of these SRM techniques that can achieve diffraction-unlimited resolution based on a purely optical modulation of fluorescence behaviors. Here, we investigated how the laser beams affect fluorescence lifetime in both confocal and STED imaging modes. The results showed that with increasing illumination time, the fluorescence lifetime in two kinds of fluorescent microspheres had an obvious change in STED imaging mode, compared with that in confocal imaging mode. As a result, the reduction of saturation intensity induced by the increase of fluorescence lifetime can improve the STED imaging resolution at the same depletion power. The phenomenon was also observed in Star635P-labeled human Nup153 in fixed HeLa cells, which can be treated as a reference for the synthesis of fluorescent labels with the sensitivity to the surrounding environment for resolution improvement in STED nanoscopy.
Keywords: confocal microscopy, fluorescence lifetime, fluorescence microscopy, super-resolution
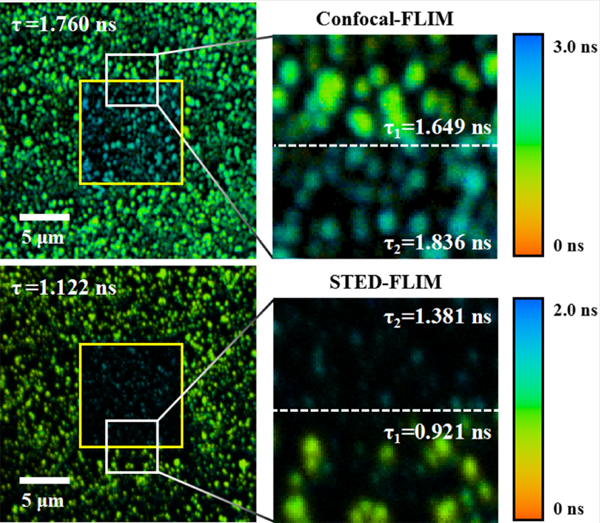
Graphical Abstract
1 |. INTRODUCTION
Since the emergence of super-resolution microscopy (SRM), the human eye has been empowered in an unprecedented fashion by means of lenses for the observation of enlarged images of tiny objects less than 200 nm in size [1–3]. In recent decades, different strategies based on fluorescence technique have been developed to carry out super-resolution imaging. Among them, stimulated emission depletion (STED) nanoscopy represents a major SRM technique, which was the first SRM technique to be proposed theoretically and experimentally realized [4–6]. In STED nanoscopy, diffraction-unlimited resolution can be obtained by minimizing the effective point spread function (PSF) via the stimulated emission effect of fluorophores from the excited state to the ground state. However, the photophysical and photochemical properties of fluorescent labels and some external factors limit the performance of STED nanoscopy [7–9].
The STED imaging resolution can be described by the formula: R = λ/[2NA (1 + ISTED/IS)1/2], showing its dependence on the wavelength (λ), the numerical aperture of the objective (NA), the depletion beam intensity (ISTED) and the saturation intensity (IS). Generally, the fluorescent label and numerical aperture of the objective are predetermined in a STED imaging system, and therefore, high depletion power is applied to improve the imaging resolution. However, higher depletion power can cause more photobleaching and phototoxicity, which is harmful for both fluorescent probes and biological samples [10, 11]. The saturation intensity (IS) gives the intensity value at which the population of the excited state has been depleted to 1/e. IS is readily calculated as hc/(τλSTED σSTED), where σSTED is the cross section for stimulated emission, λSTED is the wavelength of STED laser, and τ is the fluorescence lifetime [12, 13]. When the spot size of the laser beam is determined, the saturation intensity is proportional to the saturation power. For a fluorescent label, the saturation power is basically unchanged in a steady environment because of its constant cross section and fixed fluorescence lifetime. However, the fluorescence lifetime is sensitive to some external factors such as temperature, polarity and fluorescence quenchers [14, 15]. Therefore, the reduction of saturation power by the increase of fluorescence lifetime can be expected to improve the STED imaging resolution.
In this work, we investigated the fluorescence lifetime changes with illumination time both in confocal and STED imaging modes. The experiments were performed with two kinds of fluorescent microspheres (40 nm and 100 nm in diameter) that are usually used to calibrate the imaging resolution in STED nanoscopy. To observe the changes of fluorescence lifetime, a STED-FLIM Fluorescence lifetime imaging microscopy (FLIM) imaging system was herein developed that can simultaneously collect intensity and lifetime signals of fluorescent label. In two samples of fluorescent microspheres, the fluorescence lifetime increased with illumination time in both confocal and STED imaging modes. However, more obvious increase in the fluorescence lifetime was obtained in STED imaging mode, leading to the improvement of resolution. Based on this phenomenon, resolution improvement at the same depletion power was also achieved in biological sample (Star635P-labeled human Nup153 in fixed HeLa cells) with prolonging illumination time in STED imaging mode.
2 |. MATERIALS AND METHODS
2.1 |. The STED-FLIM imaging system
To carry out STED-FLIM imaging, a home-built optical system was constructed (Figure 1). The excitation beam at a wavelength of 635 nm was provided by a picosecond diode laser head (LDH-D-C-635; PicoQuant, Germany) Picosecond diode laser head/laser drive (PicoQuant, Berlin, Germany); Ultrafast Ti:sapphire laser (Coherent, Santa Clara, California). The depletion beam at a wavelength of 760 nm was provided by an ultrafast Ti:sapphire laser with a temporal width of 140 fs. The excitation beam was modulated by a laser driver (PDL 800-D; PicoQuant) which was triggered by the depletion laser source at the same pulse repetition frequency of 80 MHz. The excitation beam was coupled into a single-mode fiber before being expanded and collimated by the collimation lens (CL1). Half wave plate and Glan-laser polarizer (GLP) were used to adjust the laser intensity and maintain the linear polarization. In the excitation path, a delay line controlled by a retro reflector was used to adjust the interval of two series pulses. To match the pulse width of two pulses and to reduce the photobleaching of the fluorophores in the sample, a glass rod and a 100-m single-mode polarization-maintaining fiber temporally stretched the depletion laser pulses to approximately 200 ps [8, 16, 17]. In addition, a vortex phase plate (VPP-1c; RPC Photonics, New York) Vortex phase plate (RPC Photonics, New York) phase coded the depletion beam from Gaussian to a donut shape, after which the beam was converted to right-hand circular polarization by a quarter wave plate (QWP) to achieve better imaging resolution. Two dichroic mirrors (DMs) were used for the selection of wavelength, where DM1 (transmission: 659–1000 nm, reflection: 635 nm) reflected the excitation beam and transmitted the depletion beam, and DM2 (transmission: 760–1000 nm, reflection: 600–760 nm) transmitted the depletion beam and reflected the fluorescence signal. An oil-immersion objective (HCX PL APO, 100×/1.40–0.70 OIL; Leica, Berlin, Germany) was placed after a pair of galvanometer scanning mirrors (6210H; Cambridge Technology Inc., Cambridge, Massachusetts) Galvanometer scanning mirrors (Cambridge Technology, Bedford, Massachusetts). The sample was fixed on a three-dimensional stage (MPC-385 Series; Sutter Instrument Company) three-dimensional stage (Sutter Instrument Company, Novato, California) with full travel of 25 mm and a minimum step size of 62.5 nm along each axis. The fluorescence signal collected by the objective was reflected by DM2 and transmitted to a photomultiplier tube (PMT) (H7422–40; Hamamatsu Photonics, Japan) through a multimode fiber (MMF). The fiber core with the diameter of 105 μm (numerical aperture: 0.22 NA) was treated as the pinhole of the confocal system. A filter (transmission: 690 nm, bandwidth: 50 nm) was mounted before the MMF to improve the signal-to-noise ratio (SNR) by eliminating the stray light. The PMT output signal was divided into two parts, respectively, for intensity imaging and fluorescence lifetime imaging. A preamplifier was placed before the computer to amplify the fluorescence signal and to connect the synchronous reference signal to a time-correlated single photon counting card (SPC150; Becker & Hickl) time-correlated single photon counting card (SPC150, Becker&Hickl, Berlin, Germany) from the excitation path. The data acquisition and fluorescence lifetime analysis were performed by SPCM software (SPC150 and SPCImage).
FIGURE 1.
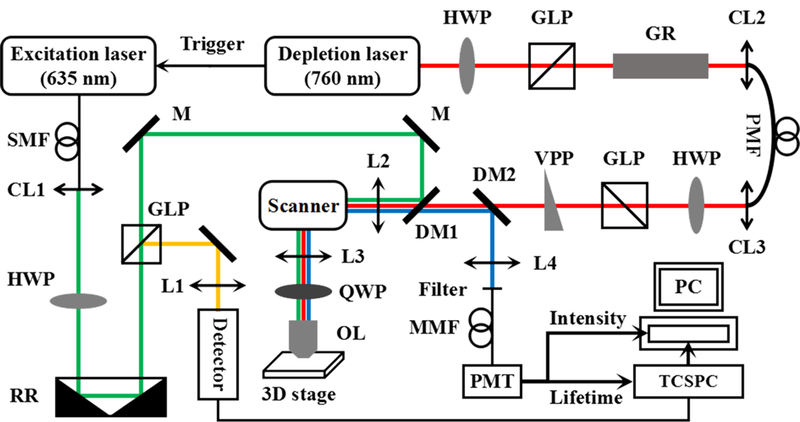
Schematic diagram of the STED-FLIM imaging system. L, lens; CL, collimation lens; HWP, half wave plate; GLP, Glan-laser polarizer; GR, glass rod; RR, retro reflector; M, mirror; VPP, vortex phase plate; DM, dichroic mirror; OL, objective lens; QWP, quarter wave plate; SMF, single-mode fiber; PMF, polarization-maintaining fiber; MMF, multimode fiber; PMT, photomultiplier tube; STED, stimulated emission depletion
2.2 |. Sample preparation
In this work, three samples were prepared, including two kinds of fluorescent microspheres (40 nm and 100 nm in diameter) and human Nup153 (a protein as an essential component of the basket of nuclear pore complexes in vertebrates is encoded by the Nup153 gene) in fixed HeLa cells. The preparation of 40 nm fluorescent microspheres (FluoSpheres carboxylate-modified, 0.04 μm, dark red [660/680]; Invitrogen) was as follows: (a) a microsphere solution (4 μL) was diluted at a ratio of 1:500 in 2 mL distilled water, (b) the diluted solution (5 μL) was attached to a cover slip and then mounted on a glass slide in 97% 2,20-thiodiethanol until the solvent completely evaporated and (c) the sample was sealed with nail polish. The preparation of 100 nm fluorescent microspheres (TetraSpeck microspheres, 0.1 μm, blue/green/orange/dark red; Invitrogen) used similar steps except the dilution ratio. To prepare the HeLa cell sample, the detection of Anti-Nup153 (Abcam, Cambridge, UK) was performed using secondary antibodies labeled with Star 635P (Abberior, Göttingen, Germany). A detailed description of the steps can be found in [18].
3 |. RESULTS AND DISCUSSION
In order to observe the influence of laser beams on the fluorescence lifetime, we first imaged 40 nm fluorescent microspheres in confocal and STED imaging modes, respectively. Figure 2 shows the fluorescence lifetime change with increasing illumination time (or acquisition times) at different laser powers. In Figure 2, the fluorescence lifetime of the fluorescent microspheres was measured in confocal imaging mode with the excitation power of 13.2 μW, 28.9 μW and 44.2 μW, and in STED mode with the depletion power of 9 mW, 12 mW and 15 mW under the excitation power of 44.2 μW (the laser powers were measured at the back aperture of the objective lens). The initial fluorescence lifetime in STED imaging mode was shorter than that in confocal imaging mode because of stimulated emission. The fluorescence lifetime is related to two kinds of transition processes and reduced according to the formula: τ = 1/(kfl + kSTED) = 1/(kfl + σSTED × ISTED), where kfl is the spontaneous emission rate in the absence of the depletion beam, and kSTED is the stimulated emission rate given by the stimulated emission cross section σSTED and the depletion beam intensity ISTED [19, 20]. In the experiments, the frame frequency of intensity imaging is approximately one frame per second with the image format of 512 × 512 pixels. Combining the FLIM technique with confocal (or STED) imaging system, the collection time of a FLIM image can be increased for gathering more photons to avoid inaccurate analysis of lifetime data.
FIGURE 2.
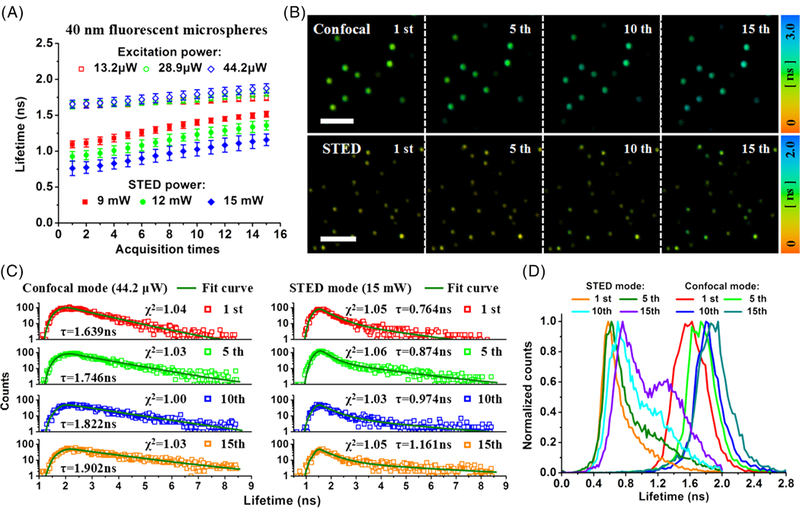
A, influence of laser beams on the fluorescence lifetime of 40 nm fluorescent microspheres at different laser powers in confocal and stimulated emission depletion (STED) imaging modes, respectively. B, confocal- and STED-FLIM images at different illumination time (ie, the 1st, 5th, 10th and 15th FLIM images in both imaging modes). Scale bar: 2 μm. (C,D), the decay kinetics and the distribution histograms. χ2: reduced chi-square value; pixel dwell time: 4 μs; the exposure time per pixel: 45 μs; pixel size: 20 nm
The independence of fluorescence lifetime is a major advantage of fluorescence lifetime imaging; however, it is only valid for fluorescent labels in a certain microenvironment in which the fluorophores do not interact either chemically or photonically. The measured fluorescence lifetime is equivalent to the average lifetime value of the molecule remaining in the excited state [14]. Continuous illumination with the excitation beam can induce a small change in the microenvironment, resulting in a small fluorescence lifetime change in confocal imaging mode (Figure 2A). However, the fluorescence lifetime gradually increased with illumination time in STED imaging mode, and an obvious fluorescence lifetime change appeared compared with that in confocal imaging mode. This means that the fluorescence lifetime was more susceptible in STED imaging mode where the depletion beam with a high power was applied. The fluorescence lifetime changes of 40 nm fluorescent microspheres in confocal and in STED imaging modes at different illumination time are presented in the FLIM images (the 1st, 5th, 10th and 15th FLIM images in both imaging modes) (Figure 2B). The collection time of a FLIM image was 12 seconds, and the sample was scanned several times at the frame frequency of intensity imaging during this period. With the increase of illumination time, the color of FLIM images gradually changed, from green to cyan blue in confocal imaging mode and from yellow-green to green in STED imaging mode (with the excitation power of 44.2 μW and STED power of 15 mW). After fitting the raw data by SPCM software, the average lifetime of 40 nm fluorescent microspheres can be obtained (Figure 2C). It increased from 1.639 ns (the first confocal-FLIM image) to 1.902 ns (the 15th confocal-FLIM image) in confocal imaging mode and from 0.764 ns (the first STED-FLIM image) to 1.161 ns (the 15th STED-FLIM image) in STED imaging mode. Moreover, the increase in the fluorescence lifetime can also be proved from the distribution histograms in Figure 2D. Although the photons collected by PMT decreased with increasing illumination time due to photobleaching, the center of photon distribution moved to the direction of long fluorescence lifetime.
The fluorescence lifetime is the amplitude-weighted average of a single exponential fit for confocal images and double exponential fit for STED images to the data. The fluorescence lifetime of most photons in the excited state has changed in STED imaging mode due to the stimulated emission effect, which means it needs multiexponential curve to fit the fluorescence lifetime. However, the fluorescence lifetime of STED images can be treated as a combination of long lifetime and short lifetime, which represented the spontaneous emission effect and the stimulated emission effect from the central region and the annular region of the depletion beam, respectively [21]. Therefore, double exponential curve can not only fit the lifetime very well but also simplify the processing. Because the phenomenon of the lifetime increase was observed in both imaging modes and the lifetime was fitted with the same weighted, the fluorescence lifetime increase is not caused by fluorescence parameters but other factors. Besides, both two laser beams were circularly polarized after passing through a QWP. We changed the position of the QWP in the optical system to further study the influence of polarization of laser beams. The same effect of increasing lifetime with time can still be observed, therefore, the polarization does not affect the increase of fluorescence lifetime.
The phenomenon was also found in the sample of 100 nm fluorescent microspheres. As shown in Figure 3A, the fluorescence lifetime had an obvious increase in STED imaging mode compared with that in confocal imaging mode. The increase in the fluorescence lifetime can also be seen from the FLIM images (Figure 3B). With the excitation power of 46.2 μW and STED power of 12 mW, the fluorescence lifetime increased from 2.847 ns (the first confocal-FLIM image) to 3.020 ns (the 10th confocal-FLIM image) in confocal imaging mode and from 0.965 ns (the first STED-FLIM image) to 1.385 ns (the 7th STED-FLIM image) in STED imaging mode. The increase in the fluorescence lifetime will lead to the reduction of the saturation intensity, which means the resolution in first few STED images is not optimal.
FIGURE 3.

A, influence of laser beams on the fluorescence lifetime of 100 nm fluorescent microspheres at different laser powers in confocal and stimulated emission depletion (STED) imaging modes, respectively. B, confocal- and STED-FLIM images at different illumination time (ie, the 1st, 4th, 7th and 10th confocal-FLIM images and the 1st, 3th, 5th and 7th STED-FLIM images). Pixel dwell time: 4 μs; the exposure time per pixel: 45 μs; pixel size: 20 nm; scale bar: 2 μm
In two kinds of fluorescent microspheres (40 nm and 100 nm), the fluorescence lifetime increased with prolonging illumination time both in confocal and STED imaging modes. Therefore, the fluorescence lifetime must be higher than that in the area that has not been exposed to the lasers for long periods of time. In the sample of 40 nm fluorescent microspheres, the microspheres in the field of view (FOV) of 10 × 10 μm2 were scanned for 3 minutes, then the FOV was zoomed in to 27 × 27 μm2. As shown in Figure 4, the enlarged FOV contains two areas: the center area (the yellow marking area) and the remaining area, and these images were obtained with the illumination time of 12 seconds (ie, the first FLIM image after zooming in the FOV). Therefore, the center area was illuminated for a long time, and the remaining area was illuminated for a short time in both confocal-FLIM and STED-FLIM images. With the excitation power of 45 μW and STED power of 12 mW, the average fluorescence lifetime was 1.760 ns in confocal-FLIM image and 1.122 ns in STED-FLIM image, which were fitted by the double exponential curve. However, each fluorescence lifetime of these two areas in a FLIM image was different from the average fluorescence lifetime. By fitting the fluorescence lifetime of each area with single exponential curve, we can see that the fluorescence lifetime of 1.836 ns in the center area of confocal-FLIM image is higher than the average fluorescence lifetime of the whole image and even higher than the fluorescence lifetime of 1.649 ns in the remaining area (Figure 4A). However, the difference in the fluorescence lifetime is minor in time-resolved confocal image, which only shows a little intensity change (Figure 4B). Similarly, the fluorescence lifetime of 1.381 ns in the center area of STED-FLIM image was also higher than the average fluorescence lifetime of whole image and even higher than the fluorescence lifetime of 0.921 ns in the remaining area (Figure 4C). After illuminating the sample for a long time in STED imaging mode, the signal intensity was reduced due to photobleaching, which can be clearly seen from Figure 4D. However, the resolution of microspheres in the center area seems higher than that in the remaining area without considering the difference in signal intensity.
FIGURE 4.
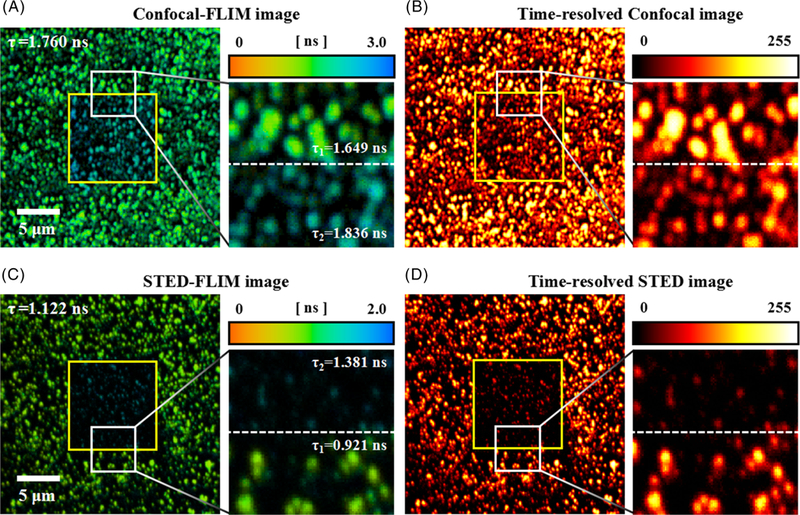
(A,B), confocal-FLIM image and corresponding time-resolved confocal image of 40 nm fluorescent microspheres, as well as their enlarged images of the white marking areas. (C,D) STED-FLIM image and corresponding time-resolved STED image of 40 nm fluorescent microspheres, as well as their enlarged images of the white marking areas. Pixel dwell time: 4 μs; the exposure time per pixel: 45 μs; pixel size: 52 nm. STED, stimulated emission depletion
Imaging resolution in STED nanoscopy improves with the increase of the depletion power, so that a higher depletion power can be used to obtain higher resolution. However, higher depletion power can give rise to photobleaching and phototoxicity, which are harmful for both fluorescent probes and biological samples. The saturation power of fluorophores is correlated with their fluorescence lifetime. Therefore, the increase in the fluorescence lifetime will be beneficial for the reduction of the saturation power, indicating that the same imaging resolution can be achieved in a lower depletion power. As shown in Figure 5A, the time-resolved confocal image of 40 nm fluorescent microspheres has an imaging resolution lower than 250 nm, and some of the microspheres are so close to each other that they cannot be distinguished. With the depletion power of 15 mW in STED imaging, we can see two microspheres in the white square area of the first STED image (acquisition times: 1st, collection time: 12 seconds). By Gaussian fitting the intensity profiles along the white dotted lines, the full-width at half-maximums (FWHMs) of these two microspheres can be obtained, which are 254 nm and 323 nm in confocal image and 178 nm and 222 nm in first STED image. Continuous illumination and acquisition of the images were performed in STED imaging mode. In 5th STED image, the intensity of fluorescence signal had no significant reduction, and the FWHMs only had little improvement. However, the FWHMs of two microspheres, respectively, improved to 162 nm and 182 nm in 15th STED image despite the signal reduction (Figure 5B). It can be determined that the fluorescence signal is gradually reduced with increasing illumination time because of photobleaching, especially in STED imaging mode. Extending collection time of the signal will be beneficial for obtaining a FLIM image with relatively high SNR, which cannot be achieved in intensity imaging.
FIGURE 5.
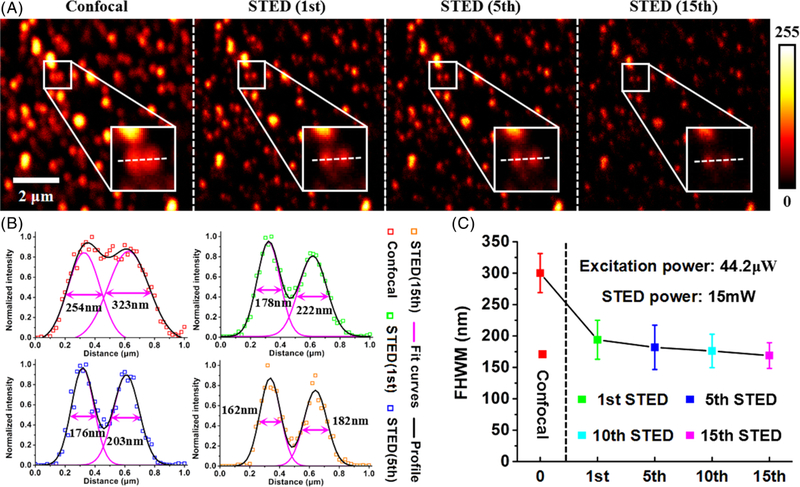
A, a time-resolved confocal image and three time-resolved stimulated emission depletion (STED) images of 40 nm fluorescent microspheres at different illumination time (ie, the 1st, 5th and 15th STED-FLIM images). B, the FWHMs of two microspheres by using Gaussian fitting in four images of (A). C, resolution improvement with the increase of fluorescence lifetime in STED imaging mode
The FWHM of the PSF provides a useful criterion for the resolution of a microscope, which is often used to determine the imaging resolution in STED nanoscopy. Recently, a robust approach, called Fourier ring correlation, can also be used in evaluating an absolute resolution value directly from any STED image [22]. But in this situation, the FWHM criterion with Gaussian fitting is enough to evaluate the imaging resolution because the applied depletion power is lower (higher SNR conditions). Therefore, the reduction of FWHM (the mean FWHM of 10 microspheres) is equivalent to the improvement of resolution, as is shown in Figure 5C (the 10th time-resolved STED image not shown). As a result, the improved imaging resolution of 40 nm fluorescent microspheres was obtained at the same depletion power by increasing the illumination time in STED imaging mode.
The red dye Star635P is a common fluorescent dye in STED imaging of biological sample. Therefore, the sample of Star635P-labeled human Nup153 in fixed HeLa cells was imaged in the STED-FLIM system to prove the resolution improvement by using the same approach as before. As shown in Figure 6A, four FLIM images were recorded, including one confocal-FLIM image and three STED-FLIM images at different illumination time. We can see that the fluorescence lifetime in confocal image was much longer than that in STED images. However, the fluorescence lifetime in STED imaging mode gradually increased with increasing illumination time, resulting in a blue-shifted color of STED-FLIM images (collection time: 4 seconds). Figure 6B shows the time-resolved images by zooming out the FOV in Figure 6A. The FWHM of single Nup153 was increasingly smaller with the illumination time at the same depletion power. After an illumination time of 60 seconds, the FWHM was reduced from 205 nm to 178 nm at the depletion power of 15 mW (Figure 6C). The increase in the fluorescence lifetime is beneficial to the resolution improvement; however, the photobleaching will become more and more serious after prolonging the illumination time by two laser beams. Therefore, there is a balance between imaging resolution and signal intensity. In addition, the excitation source has selectable repetition rates from 2.5 MHz to 80 MHz at the base frequency of 80 MHz. To study the influence of repetition rate to the fluorescence lifetime, 40 nm fluorescent microspheres were illuminated by only excitation source at the repetition rates of 40 MHz and 20 MHz (data not shown). The results showed the similar phenomenon to the experiments at the repetition rates of 80 MHz. The reduction of the repetition rate contributes to the signal increase due to low photobleaching and strong fluorescence fluxes [23]. Therefore, the repetition rate has hardly any relationship with the increase of fluorescence lifetime.
FIGURE 6.
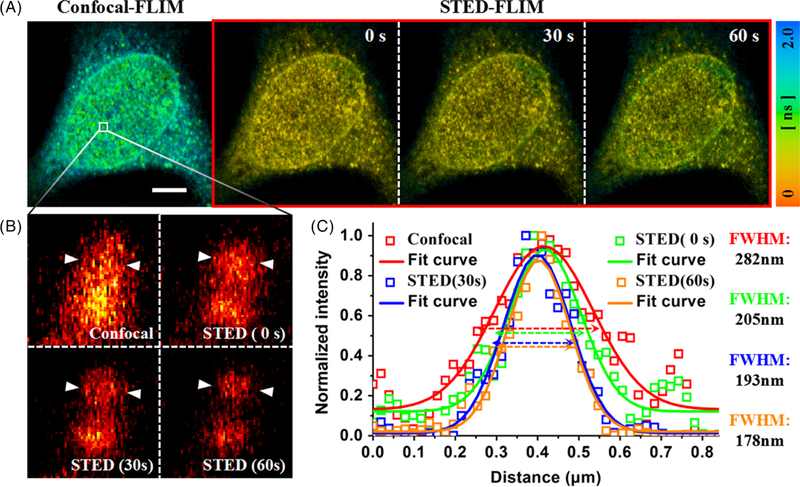
A, confocal- and STED-FLIM images of Star635P-labeled human Nup153 in HeLa cells. Scale bar: 5 μm. B, time-resolved confocal-FLIM image and three STED-FLIM images at different illumination time. C, normalized intensity profile marked by white arrows in (B). STED, stimulated emission depletion
The fluorescence lifetime increase of fluorophores by prolonging illumination time was found in three samples, including two kinds of fluorescent microspheres and Star635P-labeled human Nup153 in HeLa cells. These fluorescent dyes are usually used in STED nanoscopy for either calibrating imaging resolution of the optical system or studying biological issues. It could imagine that the phenomenon is universal in many other fluorescent dyes under this experiment condition. The phenomenon of fluorescence lifetime increase indicated that the microenvironment in the sample has changed and/or more complicated processes of molecules transition are involved. The fluorescence lifetime is a relatively long process on the timescale of molecular events, which can be affected by some external factors (eg, viscosity, polarity, pH, temperature and fluorescence quenchers) [15, 24]. These samples were sealed, so oxygen content (or oxygen concentration) is constant without outside disruptions. Due to the measured fluorescence lifetime is always the result after quenching of reactive oxygen species (ROS), photobleaching and other processes may consume some of ROS after increasing illumination time by laser beams. Therefore, the decreased quenching effect could be the reason for the increase of fluorescence lifetime. However, more detailed researches are still needed to find the real reason, in particular to consider the more complicated processes of molecules transition at the excitation and depletion wavelengths for the dyes in use.
4 |. CONCLUSION
In this work, we first studied the influence of laser beams on the fluorescence lifetime in both confocal and STED imaging modes. The results showed that an obvious increase in the fluorescence lifetime was observed by prolonging the illumination time in STED imaging mode. The phenomenon was found in three samples, including two kinds of fluorescent microspheres and Star635P-labeled human Nup153 in fixed HeLa cells. It is possible that the phenomenon is universal in many other fluorescent dyes for STED. The fluorescence lifetime increase of the fluorophore can give rise to resolution improvement, which was proved by the reduction of FWHM in two samples (40 nm fluorescent microspheres and Star635P-labeled human Nup153 in fixed HeLa cells). In other words, the same resolution can be achieved at lower depletion power by prolonging the illumination time. Given that the increased probability of nonradiative transition (eg, photobleaching) can reduce the fluorescence signal intensity in this experimental conditions, it is suggested to find another way (eg, to synthesize fluorescent labels with the sensitivity to the surrounding environment such as viscosity, polarity or pH for resolution improvement in STED nanoscopy) to increase the fluorescence lifetime of fluorophores when the physical mechanism behind this phenomenon is revealed.
ACKNOWLEDGMENTS
This work has been partially supported by the National Key R&D Program of China (2017YFA0700500); National Basic Research Program of China (2015CB352005); the National Natural Science Foundation of China (61525503/61620106016/61835009 /81727804/61875131/61505118); Guangdong Natural Science Foundation Innovation Team (2014A030312008); Shenzhen Basic Research Project (JCYJ20150930104948169/JCYJ20160328144746940/JCYJ20170412105003520); and Nature Science Foundation of SZU (2017026).
REFERENCES
- [1].Huang B, Bates M, Zhuang X, Annu. Rev. Biochem 2009, 78, 993. [DOI] [PMC free article] [PubMed] [Google Scholar]
- [2].Schermelleh L, Heintzmann R, Leonhardt H, J. Cell Biol 2010, 190, 165. [DOI] [PMC free article] [PubMed] [Google Scholar]
- [3].Lakadamyali M, Chemphyschem 2014, 15, 630. [DOI] [PubMed] [Google Scholar]
- [4].Hell SW, Wichmann J, Opt. Lett 1994, 19, 780. [DOI] [PubMed] [Google Scholar]
- [5].Hein B, Willig KI, Hell SW, Proc. Natl. Acad. Sci. U. S. A 2008, 105, 14271. [DOI] [PMC free article] [PubMed] [Google Scholar]
- [6].Hell SW, Nat. Methods 2009, 6, 24. [DOI] [PubMed] [Google Scholar]
- [7].Galiani S, Harke B, Vicidomini G, Lignani G, Benfenati F, Diaspro A, Bianchini P, Opt. Express 2012, 20, 7362. [DOI] [PubMed] [Google Scholar]
- [8].Blom H, Widengren J, Chem. Rev 2017, 117, 7377. [DOI] [PubMed] [Google Scholar]
- [9].Liu Y, Lu Y, Yang X, Zheng X, Wen S, Wang F, Vidal X, Zhao J, Liu D, Zhou Z, Ma C, Zhou J, Piper JA, Xi P, Jin D, Nature 2017, 543, 229. [DOI] [PubMed] [Google Scholar]
- [10].Wu Y, Wu X, Lu R, Zhang J, Toro L, Stefani E, Sci. Rep 2015, 5, 14766. [DOI] [PMC free article] [PubMed] [Google Scholar]
- [11].Wu Y, Wu X, Toro L, Stefani E, Biophys. J 2015, 108, 477a. [Google Scholar]
- [12].Leutenegger M, Eggeling C, Hell SW, Opt. Express 2010, 18, 26417. [DOI] [PubMed] [Google Scholar]
- [13].Bossi M, Fölling J, Dyba M, Westphal V, Hell SW, New J. Phys 2006, 8, 275. [Google Scholar]
- [14].Gerritsen HC, Asselbergs MAH, Agronskaia AV, Van Sark WGJHM, J. Microsc 2002, 206, 218. [DOI] [PubMed] [Google Scholar]
- [15].Berezin MY, Achilefu S, Chem. Rev 2010, 110, 2641. [DOI] [PMC free article] [PubMed] [Google Scholar]
- [16].Dyba M, Hell SW, Appl. Optics 2003, 42, 5123. [DOI] [PubMed] [Google Scholar]
- [17].Yan W, Yang Y, Tan Y, Chen X, Li Y, Qu J, Ye T, Photonics Res 2017, 5, 176. [DOI] [PMC free article] [PubMed] [Google Scholar]
- [18].Göttfert F, Wurm CA, Mueller V, Berning S, Cordes VC, Honigmann A, Hell SW, Biophys. J 2013, 105, L01. [DOI] [PMC free article] [PubMed] [Google Scholar]
- [19].Vicidomini G, Moneron G, Han KY, Westphal V, Ta H, Reuss M, Engelhardt J, Eggeling C, Hell SW, Nat. Methods 2011, 8, 571. [DOI] [PubMed] [Google Scholar]
- [20].Ye S, Yan W, Zhao M, Peng X, Song J, Qu J, Adv. Mater 2018, 23, 1800167. [DOI] [PubMed] [Google Scholar]
- [21].Wang L, Chen B, Yan W, Yang Z, Peng X, Lin D, Weng X, Ye T, Qu J, Nanoscale 2018, 10, 16252. [DOI] [PubMed] [Google Scholar]
- [22].Tortarolo G, Castello M, Diaspro A, Koho S, Vicidomini G, Optica 2018, 5, 32. [Google Scholar]
- [23].Donnert G, Eggeling C, Hell SW, Nat. Methods 2007, 4, 81. [DOI] [PubMed] [Google Scholar]
- [24].Linde SVD, Krstic I, Prisner T, Doose S, Heilemann M, Sauer M, Photochem. Photobio. Sci 2011, 10, 499. [DOI] [PubMed] [Google Scholar]


