Figure 2.

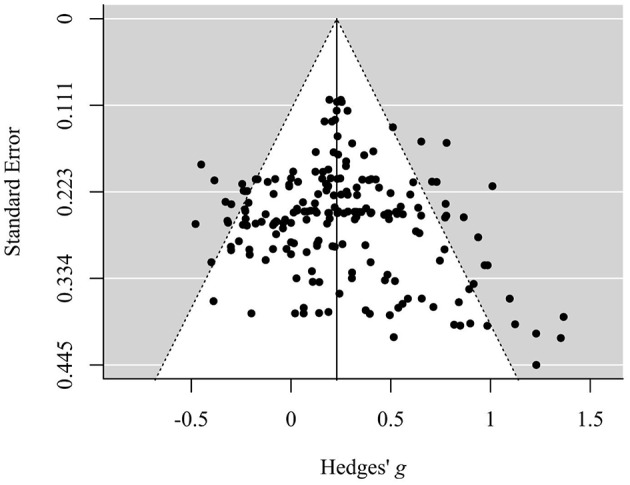
Funnel plot displaying the distribution of standard errors in dependence of corresponding standardized mean differences (Hedges' g). Data is shown on outcome level.

Funnel plot displaying the distribution of standard errors in dependence of corresponding standardized mean differences (Hedges' g). Data is shown on outcome level.