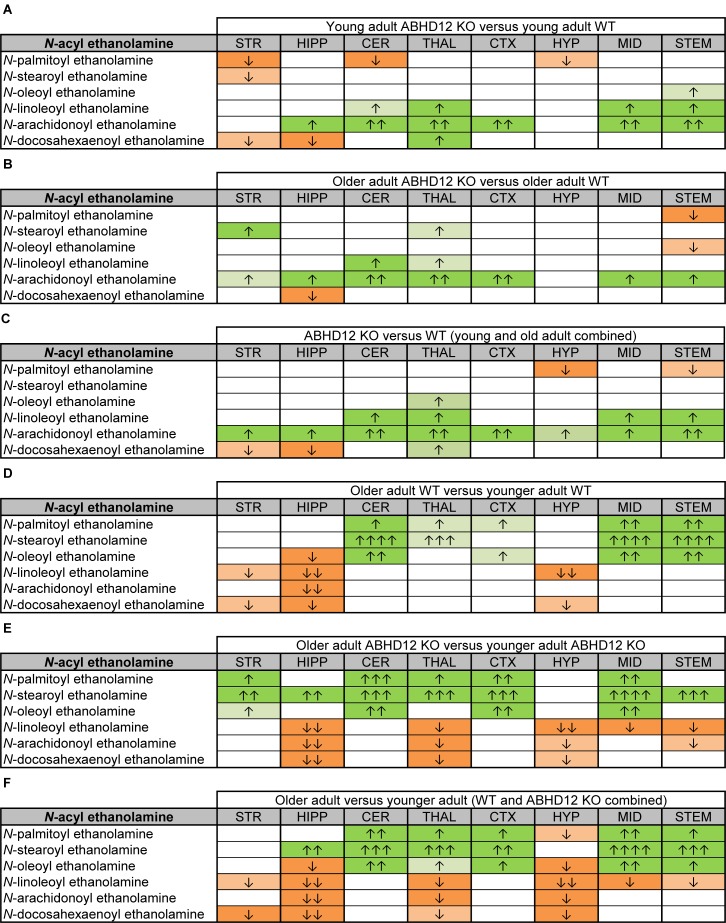
FIGURE 5.
Heatmaps of effects of ABHD12 deletion and age on levels of N-acyl ethanolamines in 8 brain regions. Cells with shaded arrows indicate a change for that lipid in the indicated brain area relative to the same control area. The arrow color indicates the direction of a significant result relative to control. Green colors represent increases, whereas orange colors represent decreases. Darker colors represent changes of p < 0.05 and lighter colors represent changes of p < 0.10. The number of arrows indicates the magnitude of the difference. One arrow indicates a magnitude difference of less than 1.5 fold, 2 arrows indicate a 1.5–1.99 fold change, 3 arrows indicate a 2–2.99 fold change, and 4 arrows indicate a 3–9.99 fold change. A blank cell indicates that there was no change in the lipid’s level. See Methods and Supplementary Figure 2 for more detailed description of analysis. Brain regions analyzed were the striatum (STR), hippocampus (HIPP), cerebellum (CER), thalamus (THAL), cortex (CTX), hypothalamus (HYP), midbrain (MID), and brainstem (STEM). (A) Shows the effect of ABHD12 deletion in younger adult brain areas, whereas (B) shows the effect of ABHD12 deletion in older adult brain areas. (C) Shows the main effect of ABHD12 deletion, combining older and younger adult mice into groups based on genotype. (D) Shows the effect of aging in WT mice, whereas (E) shows the effect of aging in ABHD12 KO mice. (F) Shows the main effect of aging, combining WT and ABHD12 KO mice into groups based on age.

