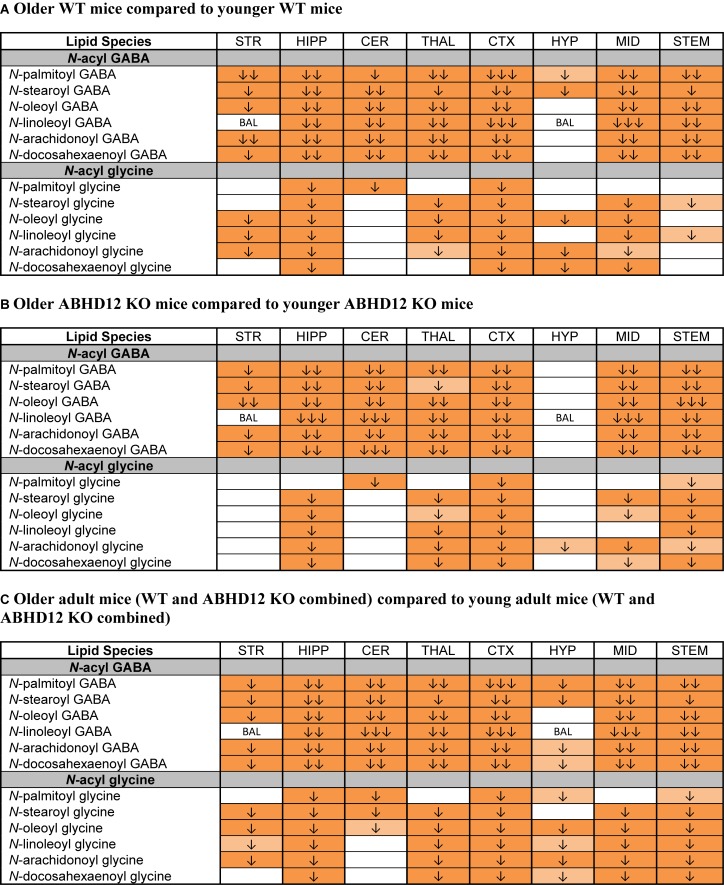
FIGURE 8.
Levels of N-acyl GABAs and N-acyl glycines decline with age. Heatmaps show effects of aging on levels of targeted N-acyl GABAs and N-acyl glycines in the striatum (STR), hippocampus (HIPP), cerebellum (CER), thalamus (THAL), cortex (CTX), hypothalamus (HYP), midbrain (MID), and brainstem (STEM). Cells with shaded arrows indicate a change for that lipid in the indicated older adult brain area relative to the same younger adult control area. The arrow color indicates the direction of a significant result relative to young adult animals. Green colors represent increases, whereas orange colors represent decreases. Darker colors represent changes of p < 0.05 and lighter colors represent changes of p < 0.10. The number of arrows indicates the magnitude of the difference. One arrow indicates a magnitude difference of less than 1.5 fold, 2 arrows indicate a 1.5–1.99 fold change, and 3 arrows indicate a 2–2.99 fold change. A blank cell indicates that there was no change in the lipid’s level. BAL, below analytical limit; meaning that the indicated analyte was not detected in all samples from that region. See Methods and Supplementary Figure 2 for more detailed description of analysis. (A) Shows how age affected levels of N-acyl GABAs and N-acyl glycines in wild-type (WT) animals. (B) Shows how age affected levels of N-acyl GABAs and N-acyl glycines in ABHD12 knockout (KO) animals. (C) Shows the comparison between older adult mice (WT and ABHD12 KO combined) and younger adult mice (WT and ABHD12 KO combined).

