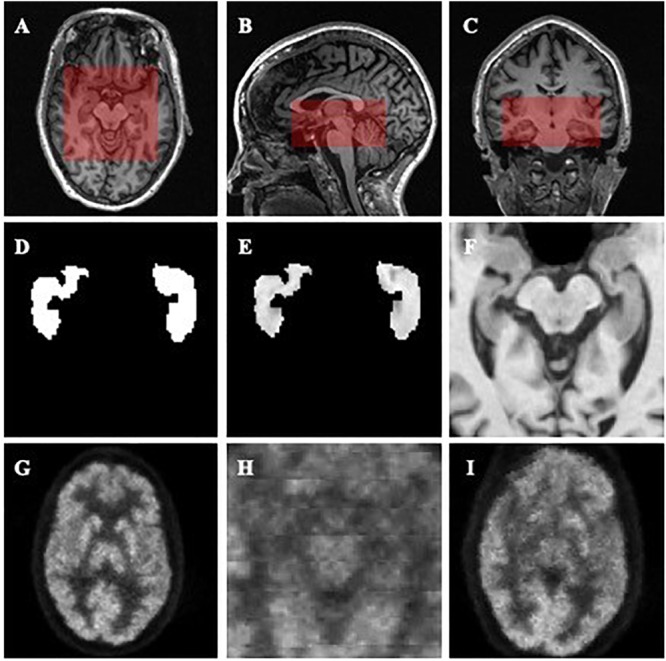
FIGURE 1.

Demonstrations of the datasets and ROIs. (A–C) demonstrate the selected ROI of MR images. (A) is an axial slice, (B) is a sagittal slice, and (C) is a coronal slice. (D–F) are generated from the same MR image to demonstrate the Mask (D), MaskedImage (E), and ImageOnly (F) groups. (D) is a mask image of the segmentation of hippocampi. (E) is a image masked by hippocampal segmentation. (F) is a cropped image. (G–I) are generated from the same PET image to demonstrate the images in the SmallRF (H) and BigRF (I) groups, while (G) is the corresponding PET image. Among them, (H) is cropped from (G), and (I) is downsampled from (G).
