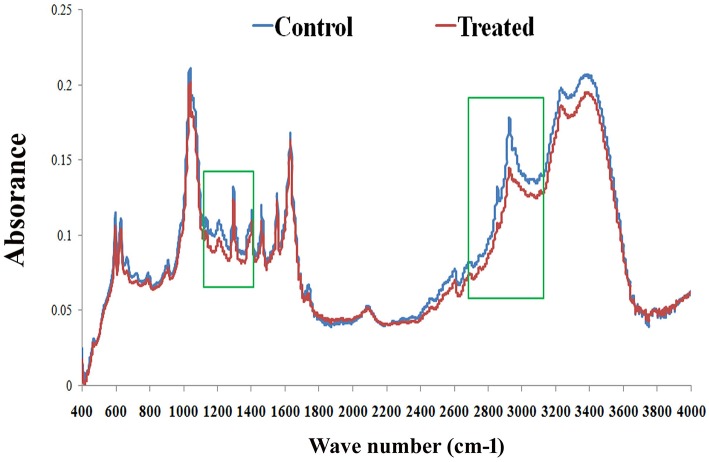
Figure 10.
FT-IR analysis of C. elegans lipids. The representative FT-IR spectra of lipids (control and treated) in the 4,000–400 cm−1 region. However, the average FT-IR spectra of the control and treated showed major signature peak difference at 3,000–2,800 cm−1 (fatty acids). Data were expressed as mean value of three experiments and the error bars represent SD ± mean (*p < 0.05).

