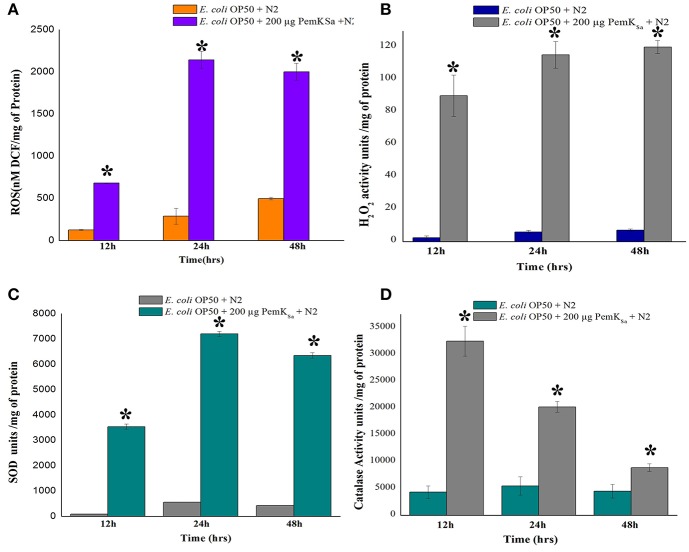
Figure 7.
Quantitative analysis of oxidant and antioxidant proteins of control and treated C. elegans. (A) ROS estimation, (B) H2O2 estimation, (C) Quantification of SOD activity, and (D) Quantification of catalase activity. Data were expressed as mean value of three experiments and the error bars represent Mean ± SD (*p < 0.05).

