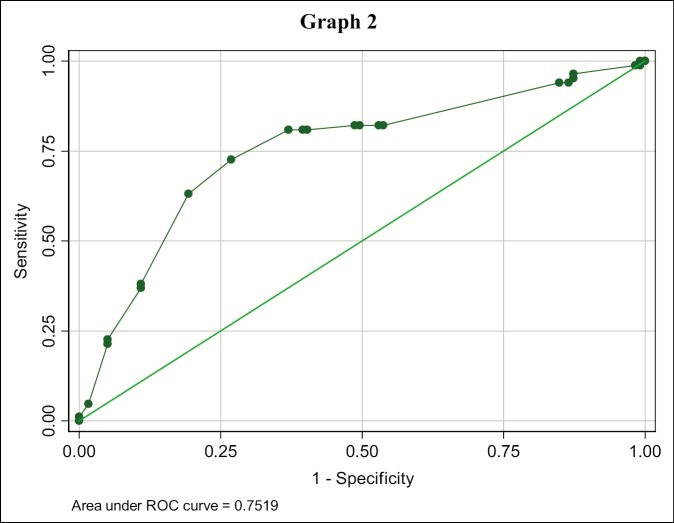
Graph 2.
Receiving operating characteristics (ROC-curve) of lymph node size for diagnosing metastasis. Each point on the ROC curve represents a sensitivity specificity pair corresponding to a decision threshold. A test with perfect discrimination (no overlap in two distributions) has a ROC curve that passes through upper left corner and corresponds with bold values for Size (Table 1).

