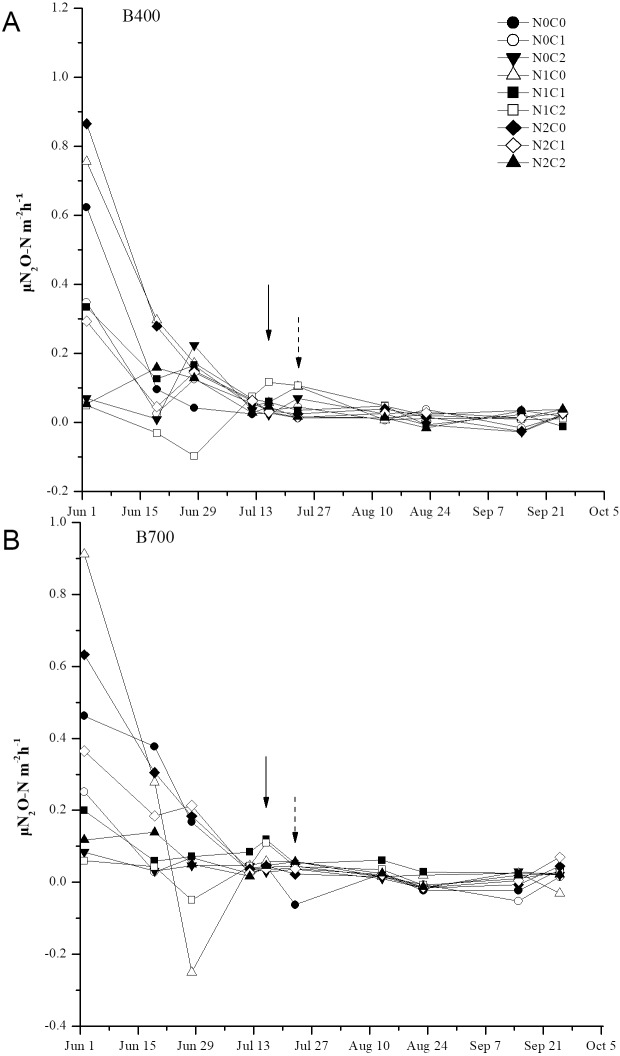
Figure 3. Time series of daily N2O emissions from paddy soil under different biochar treatments during the rice growing season.
B400 and B700; C0, C0.7, and C2.1; and N0, N210, and N168 are defined in Fig. 2 caption. Solid arrows indicate water controlling, and dot arrows indicate nitrogen fertilization. Error bars represent the standard error.

