
Fig.1: Timeline of hierarchical models of hematopoiesis.
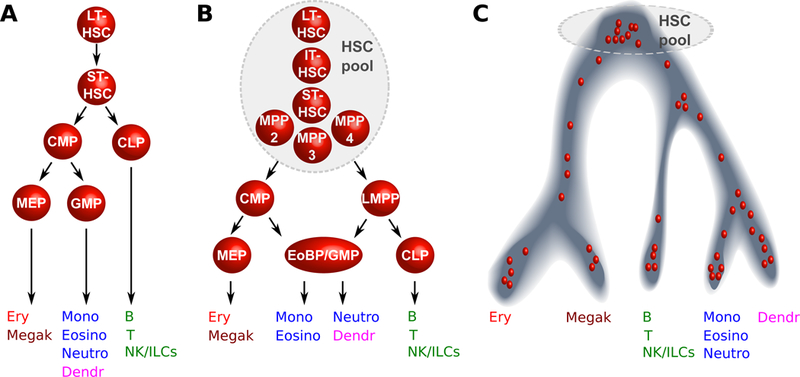
A. Visualisation based on state-of-the-art around the year 2000: HSCs are represented as a homogeneous population downstream of which the first lineage bifurcation separates the myeloid and lymphoid branches via the CMP and CLP populations; B. During the years 2005 to 2015 this visualisation incorporates new findings: the HSC pool is now accepted to be more heterogeneous both in terms of self-renewal (vertical axis) and differentiation properties (horizontal axis), the myeloid and lymphoid branches remain associated further down in the hierarchy via the LMPP population, the GMP compartment is shown to be fairly heterogeneous 141. C. From 2016 onwards, single cell transcriptomics snapshots indicate a continuum of differentiation. Each red dot represents a single cell and its localisation along a differentiation trajectory.