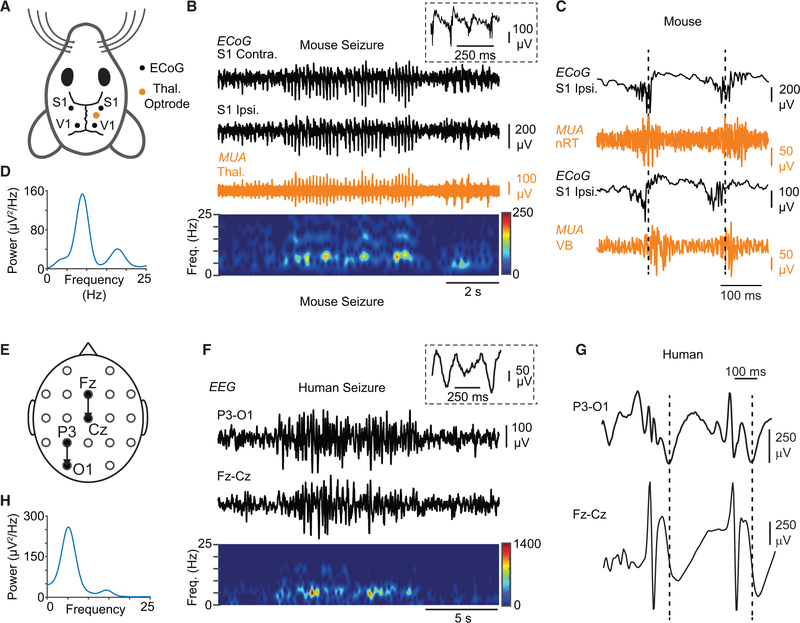
Figure 3. DS Mice Exhibit Non-convulsive Seizures Similar to Human Patients with DS.
(A) Diagram of the mouse electrocorticography (ECoG) and thalamic depth electrode recording montage. ECoG was recorded from somatosensory (S1) and visual (V1) cortices, with depth electrodes implanted in the thalamus.
(B) Top: example of an ECoG signature of a representative non-convulsive seizure in DS mice recorded from S1 (black), along with simultaneous multiunit (MU) recordings in the thalamus—in this case, the ventrobasal thalamus (orange). Inset: magnification of ECoG poly-spikes overlaid on a slower oscillation. Bottom: spectrogram showing frequency components of the recorded seizure.
(C) MU recordings in the somatosensory thalamus simultaneously with ECoG show in both nRT and VB clusters of APs (“population bursts” of AP firing) phase locked with ECoG poly-spikes.
(D) Power spectral density of the seizure shown in (B). Peak fundamental frequency is 6–7 Hz.
(E) Diagram of human EEG recording montage.
(F) Top: EEG signature of a non-convulsive seizure in a patient with DS recorded in two different locations on the scalp. Inset: spikes are not typical spike-and-wave discharges and have a higher frequency component in addition to the slower oscillation. Bottom: spectrogram showing frequency components of the recorded seizure.
(G) Expanded EEG shows epileptic activity characterized by a sequence of poly-spikes overlaid on a slower oscillation (compare with C).
(H) Power spectral density of the seizure shown in (E). Peak fundamental frequency of the depicted seizure is ~5 Hz, but it can vary across the different cortical regions for the same seizure (see Figures S3 and S4).

