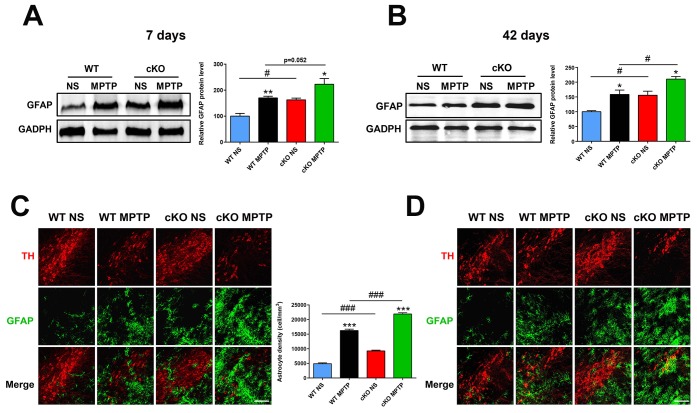
Figure 4.
NRSF deficiency correlates with increased astrocyte activation in the nigrostriatal pathways after MPTP administration. (A) Western blot analysis of striatal GFAP at 7 days after saline or MPTP administration. Quantification of GFAP expression is shown in the right panel. N = 5. (B) Immunofluorescence staining of GFAP (green) and TH (red) in the substantia nigra at 7 days after saline or MPTP administration. Scale bar: 100 μm. Statistics for GFAP-positive cells are shown in the right panel. N = 4. (C) Western blot analysis of striatal GFAP at 42 days after saline or MPTP administration. Quantification of relative GFAP expression is shown in the right panel. N = 4. (D) Immunofluorescence staining of GFAP (green) and TH (red) in the substantia nigra at 42 days after saline or MPTP administration. Scale bar: 100 μm. Data are means ± SEM. Data were analyzed by one-way ANOVA. *P < 0.05, **p < 0.01, ***p < 0.001, vs saline-treated control; #p < 0.05, ###p < 0.001, vs MPTP-treated WT mice.

