
Fig. 2.
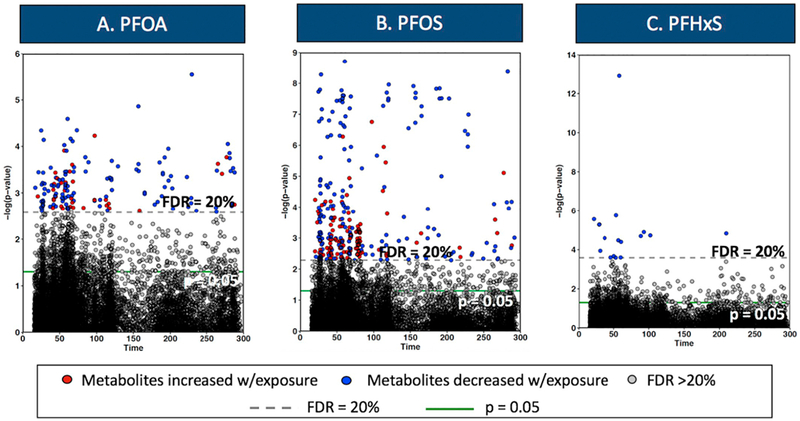
Metabolite features significantly altered in association with PFASs plasma concentrations.
Y axis represents the negative log10P for correlation of each metabolite feature with (A) PFOA, (B) PFOS and (C) PFHxS. X axis represents each metabolite in the function of retention time. Models adjusted for baseline age, sex, and social position (categorical). Metabolites above the dashed horizontal line and solid green line were significant at FDR < 20% and p < 0.05, respectively. (For interpretation of the references to colour in this figure legend, the reader is referred to the web version of this article.)