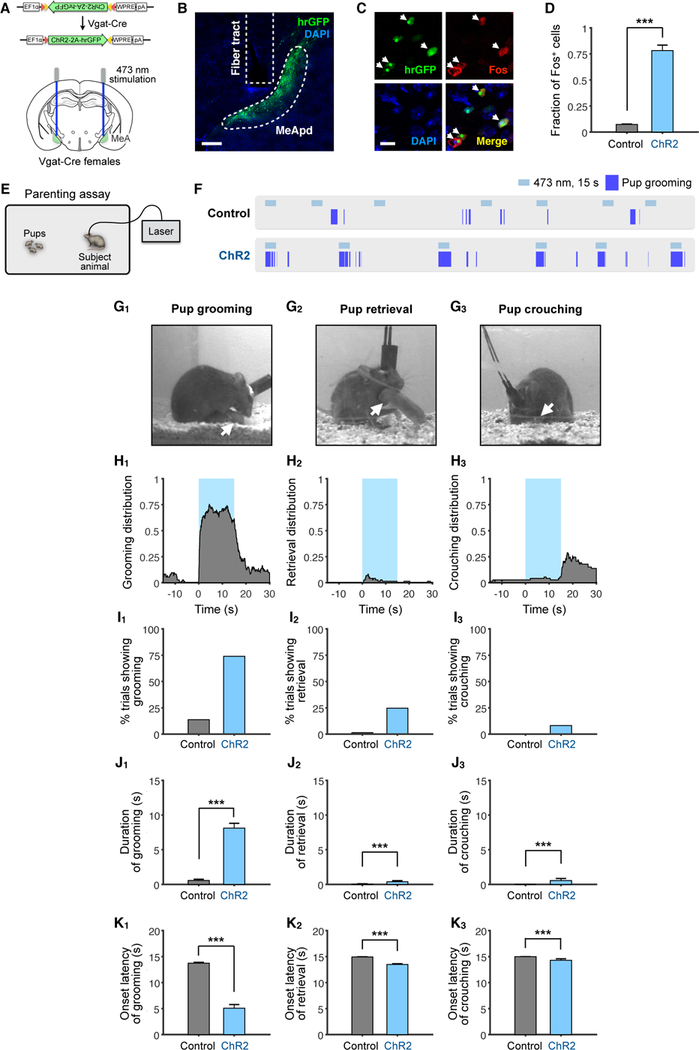
Figure 1. Optogenetic Activation of MeApd GABAergic Neurons Promotes Parenting Behavior in Virgin Females.

(A) Schematic of viral injection and fiber implantation strategy for ChR2 stimulation.
(B) Example image of injection site and viral expression. Scale bar = 200 µm.
(C) Co-localization of Fos expression and ChR2 cells (expressing hrGFP) following photostimulation. Arrowheads: co-localized cells. Scale bar = 50 µm.
(D) Quantification of Fos+/GFP+ cells in control and ChR2-injected animals. ChR2, 3 mice; Control, 2 mice.
(E) Schematic of parenting assay.
(F) Representative raster plots of control and ChR2 animals illustrating photostimulation-induced pup grooming.
(G) Example video frames of animals showing different behaviors. Arrows indicate location of pup.
(H) Distribution of pup grooming, retrieval, and crouching episodes (percentage of trials showing the indicated behavior at different time points) with respect to stimulation onset.
(I) Percentage of trials showing different photostimulation-induced behaviors.
(J) Average duration of different behaviors during stimulation.
(K) Average latency to different behaviors following onset of photostimulation. If behavior was not observed, latency was considered 15 seconds, which was the duration of stimulation. ChR2, n = 73 trials (6 mice); control, n = 138 trials (10 mice). Mean ± SEM. Wilcoxon rank-sum test. ***p < 0.001.
See also Figure S1.
