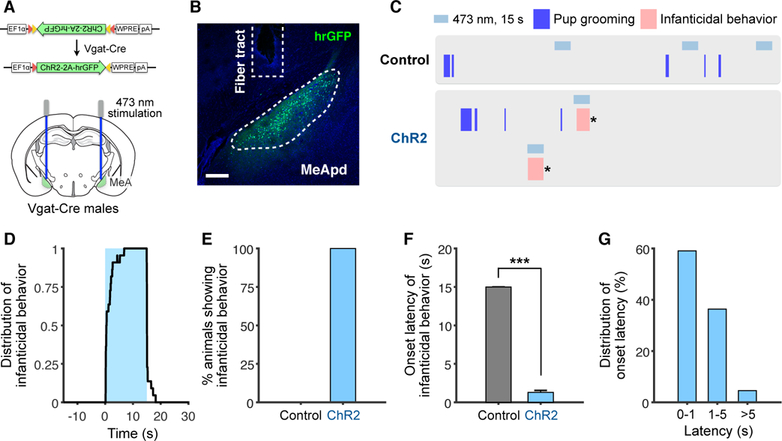
Figure 3. Activation of GABAergic Neurons Promotes Infanticidal Behavior in Virgin Males.

(A) Schematic of viral injection and fiber implantation strategy for ChR2 stimulation.
(B) Example image of injection site and viral expression. Scale bar = 200 µm.
(C) Representative raster plots of control and ChR2 animals illustrating promotion of infanticidal behavior during photostimulation. * indicates when the pup was removed.
(D) Distribution of infanticidal behavior episodes in ChR2 animals (percentage of trials showing infanticide at different time points) with respect to stimulation onset.
(E) Percentage of animals showing infanticidal behavior.
(F) Average latency until infanticidal behavior onset following stimulation initiation.
(G) Latency distribution of infanticidal behavior onset following stimulation initiation.
ChR2, n = 22 trials (5 mice); control, n = 26 trials (4 mice). Mean ± SEM. Wilcoxon rank-sum test. ***p < 0.001.
See also Figure S2.
