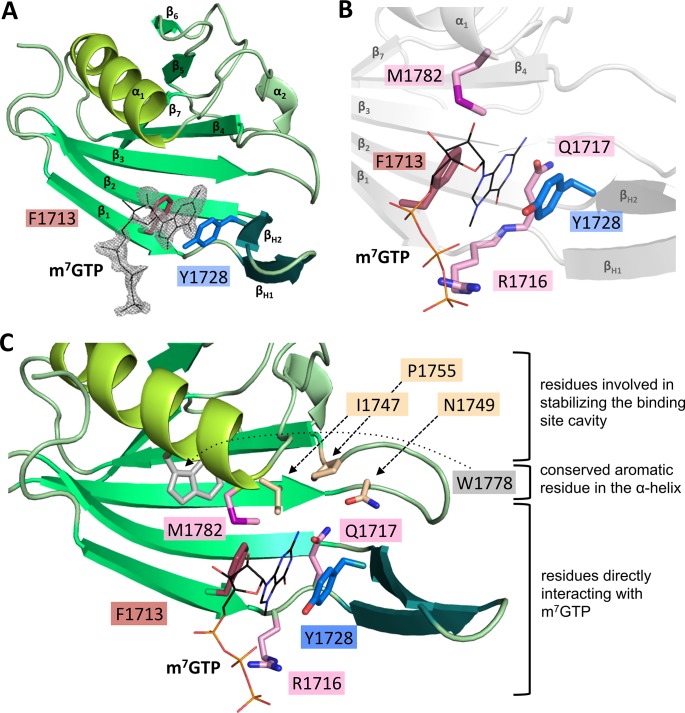
Fig 2. Interaction of m7GTP with RVFV CBD.
A) The figure shows binding of m7GTP to RVFV CBD chain A in the crystal. RVFV CBD is presented as a ribbon diagram with the side chains of the two aromatic residues typical for binding of cap-structures shown as sticks. m7GTP is presented as lines and the surrounding electron density (2|Fo|-|Fc| omit map at 1.5σ) as grey mesh. Secondary structure elements are labelled. B) Amino acid side chains interacting with the m7GTP ligand (presented as lines) are shown as sticks. The structure of RVFV CBD chain A is indicated in grey. A detailed list of interactions is given in S2 Table. C) A close-up of the m7GTP binding site is presented. The protein is shown as ribbon diagram, involved side chains as sticks and the m7GTP as lines. The residues are grouped and colored according to A) and their role in the interaction with m7GTP.

