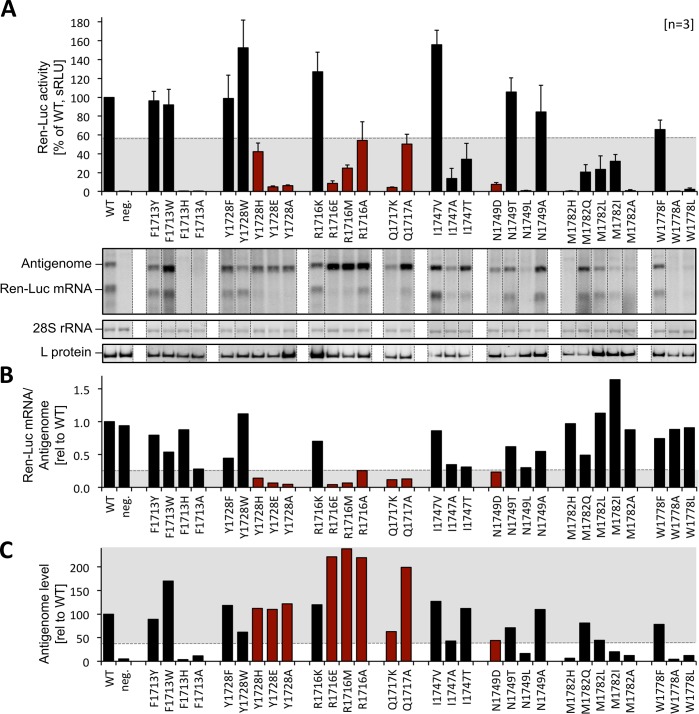
Fig 5. Minireplicon data for RVFV L protein mutants.
A) Transcriptional activity of L protein mutants was measured via Ren-Luc reporter gene expression. The Ren-Luc activity, which has been normalized to the firefly activity (transfection control), is shown in the bar graph (mean and standard deviation of standardized relative light units [sRLU] as a percentage of the wild-type in 3 independent transfection experiments [n = 3]). Among other criteria, mutants with a selective defect in viral transcription are expected to show signals below 55% of wild-type activity (range is indicated by grey background). Synthesis of the antigenome and Ren-Luc mRNA was evaluated by northern blotting using a radiolabelled antisense riboprobe hybridizing to the Ren-Luc gene. A defective L protein with a mutation in the catalytic site of the RNA-dependent RNA polymerase served as a negative control (neg.). Signals on northern blots were quantified using ImageJ2 software [58]. All lanes displayed are from the same northern blot membrane (and same autoradiogram), dotted lines indicate cutting of the lanes for presentation reasons. The original blot is presented in S9 Fig. The data are also presented numerically in S3 Table. The methylene blue-stained 28S rRNA is shown as a marker for gel loading and RNA transfer. Immunoblot analysis of FLAG-tagged L protein mutants is also shown (L protein). Columns of mutants with a selective defect in viral transcription are colored in red. For experimental details see methods section. For quantitative analysis and definition of selective transcription defects see S3 Table. B) The column chart displays the signal ratio of mRNA to antigenome, reflecting viral transcription vs. replication, relative to the wild-type as calculated from the quantified northern blot signals. The expected range of signal ratio for mutants with a selective defect in mRNA production is indicated by grey background (≤ 0.25). Columns of mutants with a selective defect in viral transcription are colored in red. C) This column chart shows the antigenome levels determined by northern blot quantification relative to the wild-type level. L protein mutants with a selective transcription defect are expected to show wild-type like antigenome levels (≥ 40%, indicated by grey background). Columns of mutants with a selective defect in viral transcription are colored in red.

