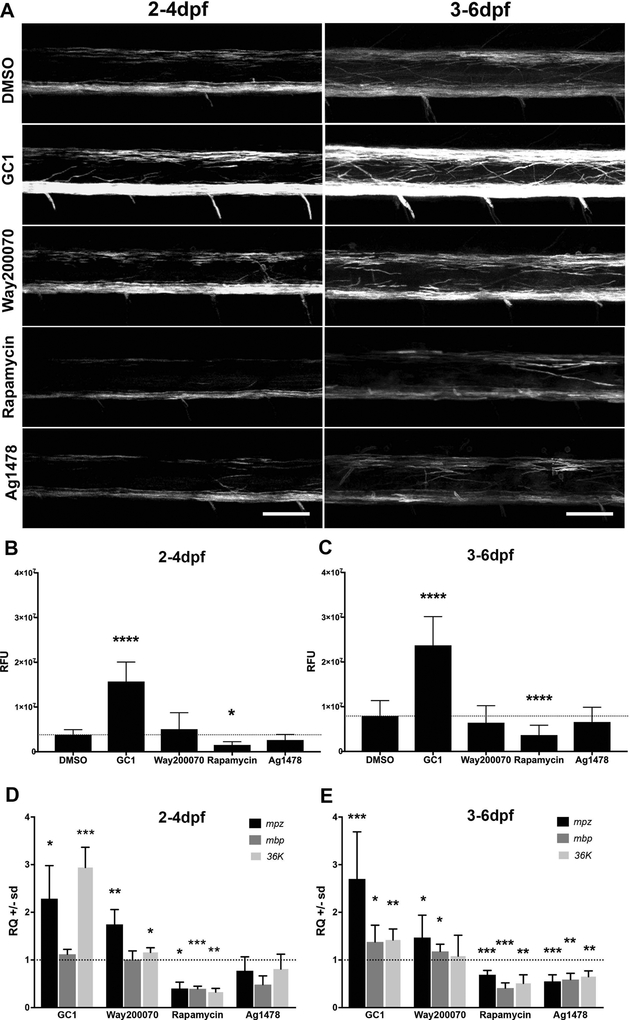
Figure 4: The mpz reporter responded to bath application of small molecule drugs.
Tg(mpz:mEGFP) larvae were incubated in embryo medium with vehicle, 10nM GC1, 10μM WAY200070, 20μM Rapamycin, or 1.5μM AG1478 in 1% DMSO during critical periods of oligodendrocyte lineage progression including initiation of myelination (2–4dpf, A-left panels) or active myelination (3–6dpf, A-right panels). Larvae were anesthetized with tricaine, mounted in low-melt agarose and live imaged using confocal microscopy (A). (B-C) Representative max projections of 3D reconstructions using Imaris image processing software were used to quantify total changes in fluorescence intensity (relative fluorescence units [RFUs]) and compared to vehicle treated controls using equivalent regions of the lateral spinal cord. (D-E) qPCR analysis of mpz, mbp and 36K mRNAs following drug treatments in age-matched larvae was consistent with the quantified changes in EGFP intensity measurements (RFUs). (scale bar = 50μM; statistical analysis: 1-way Anova, p<0.05* <0.01** <0.001*** <0.0001****)

