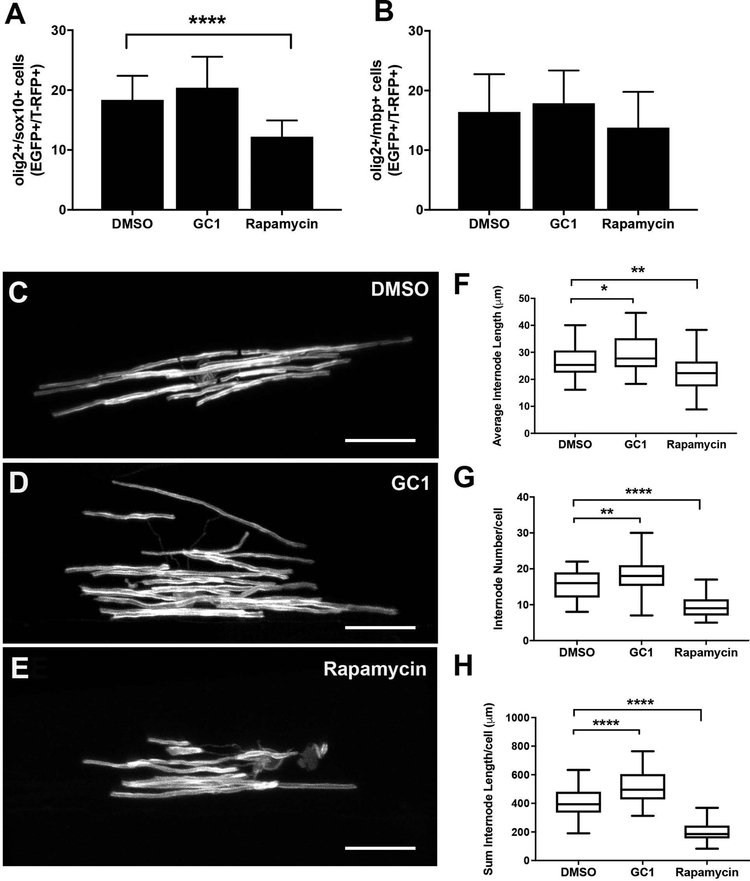
Figure 6: Morphological changes in individual oligodendrocytes following drug treatment.
Average number of dorsal oligodendrocyte lineage cells (olig2+/sox10+) was quantified from 3D reconstructions of live images of the lateral spinal cord of Tg(olig2:EGFP; sox10:T-RFP) larvae (A) or myelinating oligodendrocytes (olig2+/mbp+) from Tg(olig2:EGFP; mbp1a:T-RFP) larvae (B) following 10nM GC1 or 20μM rapamycin treatment (2–4dpf). (C-E) Representative images of individual scatter labeled oligodendrocytes and quantitative analysis of internode length (F), number of internodes (G) and total internode length generated per cell (H) following 10nM GC1 or 20μM rapamycin treatment (2–4dpf). (scale bar =25μM, statistical analysis: 1-way Anova, p<0.05* <0.01** <0.001*** <0.0001****)

