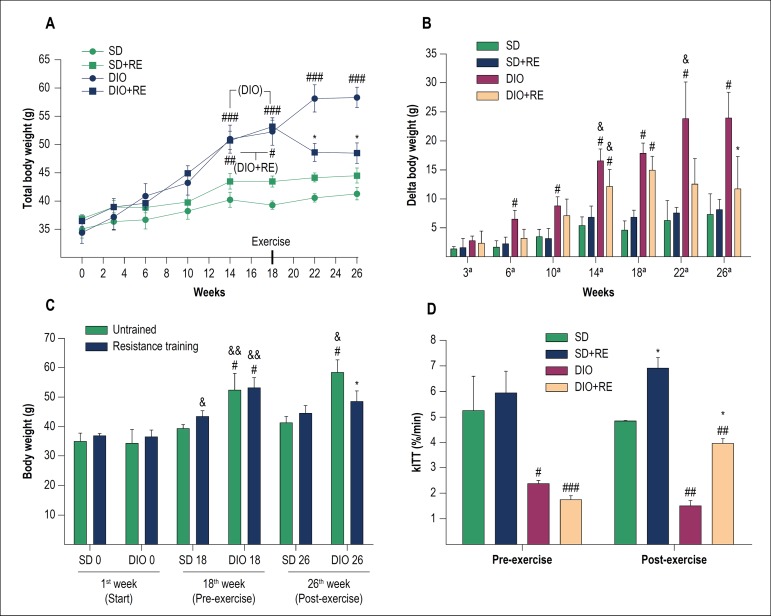
Figure 1.
A – Total body weight during the study; B - Delta (body weight variation in relation to the start of the study); C - weight comparison between the 1st week (start), 18th week (pre-exercise) and 26th week (post-exercise); D - Glucose decay rate in the insulin tolerance test (kITT). Figure A, B and D - *p < 0.05 vs. respective untrained of the same period, #p < 0.05, ##p < 0.01 and ###p < 0,001 vs. respective SD of the same period; &p < 0.05 vs. same group of the previous week. Figure C - *p < 0.001 vs. respective untrained of the same period; #p < 0.01 and ##p < 0.001 vs. respective SD of the same period; &p < 0.05, &&p < 0.001 vs. same group of the previous week.

