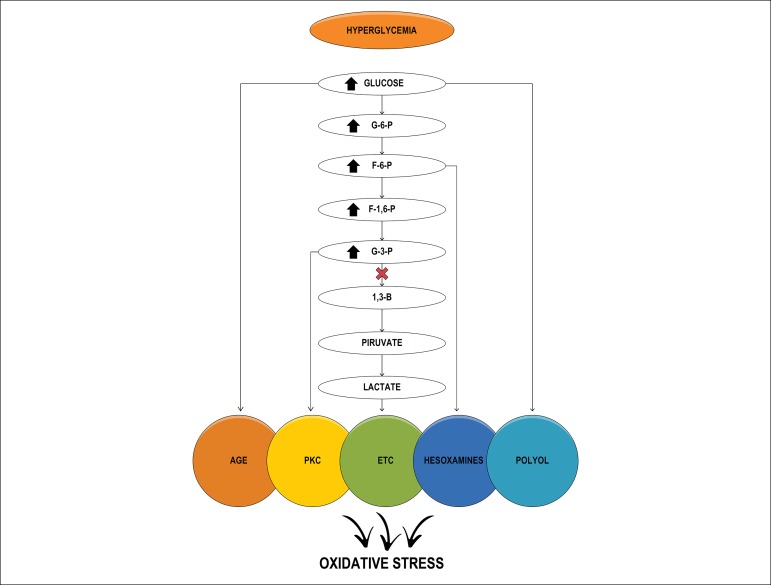
Figure 2.
Schematic representation of the pathways preceding glycolysis and induction of oxidative stress. ETC: electron transport chain; 1,3-BPG: bisphosphoglycerate; G6P: glucose 6-phosphate; G3P: glyceraldehyde-3-phosphate; GAPDH: glyceraldehyde-3-phosphate dehydrogenase; F6P: fructose-6-phosphate; F-1,6-P: fructose-1,6-phosphate; PKC: protein kinase C; AGE; advanced glycation end-products

