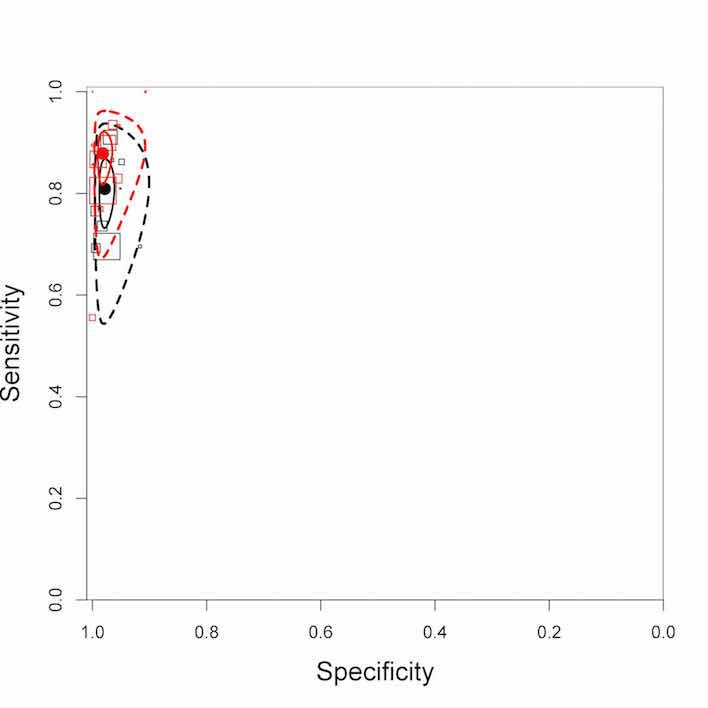
Figure 19.

Summary plots of Xpert MTB/RIF sensitivity and specificity for detection of pulmonary tuberculosis in HIV‐negative people (red) and HIV‐positive people (black). Each individual study is represented by an empty square. The of the square is proportional to the sample size of the study such that larger studies are represented by larger squares. The filled circle is the pooled median estimate for sensitivity and specificity. The solid curve represents the 95% credible region around the summary estimate; the dashed curves represent the 95% prediction region.
