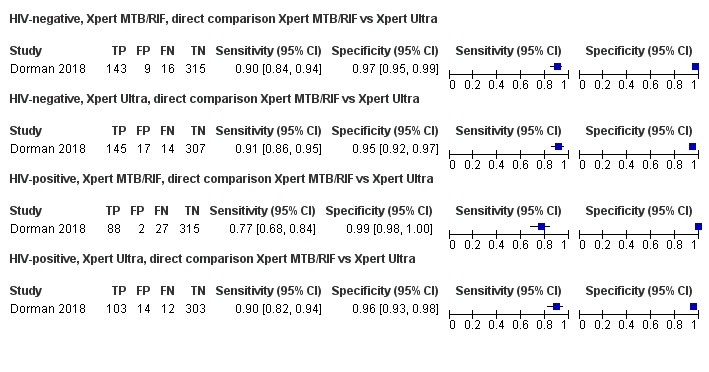
Figure 20.

Forest plots comparing Xpert MTB/RIF and Xpert Ultra sensitivity and specificity for detection of pulmonary tuberculosis in HIV‐negative and HIV‐positive participants. The individual studies are ordered by decreasing sensitivity. The squares represent the sensitivity and specificity of one study, the black line its CI. TP = true positive; FP = false positive; FN = false negative; TN = true negative.
