. 2019 May 14;8:e46149. doi: 10.7554/eLife.46149

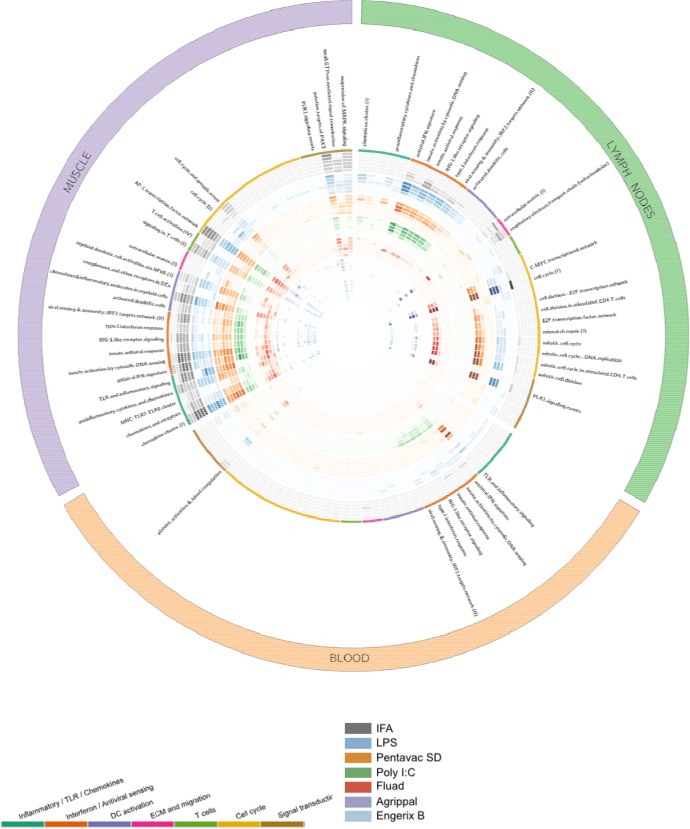
Figure 2. Gene-set enrichment analysis reveals distinct mechanisms of transcriptional response to the injected vaccines and TLR agonists.

Tissue data sets are presented as three coloured segments along the perimeter for the injected muscle (purple), the draining lymph nodes (green), and the blood compartment (red). An ordered list of blood transcriptional modules is labelled inside the outermost perimeter. Coloured bands adjacent to the module names correspond to the vaccines and Toll-like receptor (TLR) agonists (outside to inside bands): incomplete Freunds adjuvant (IFA) (grey), lipopolysaccharide (LPS) (blue), Pentavac SD (orange), Poly I:C (green), Fluad (red), Agrippal (purple), and Engerix (blue). For each band, there are six rings corresponding to time points 4, 8, 24, 48, 72, 168 hr (from outer to inner ring). The intensity of colours indicates the significance of the enrichment. Only modules with p-value for enrichment of <10−6 and an effect size (AUC) >0.8 are shown. DC, dendritic cell; ECM, extracellular matrix.

Figure 2.

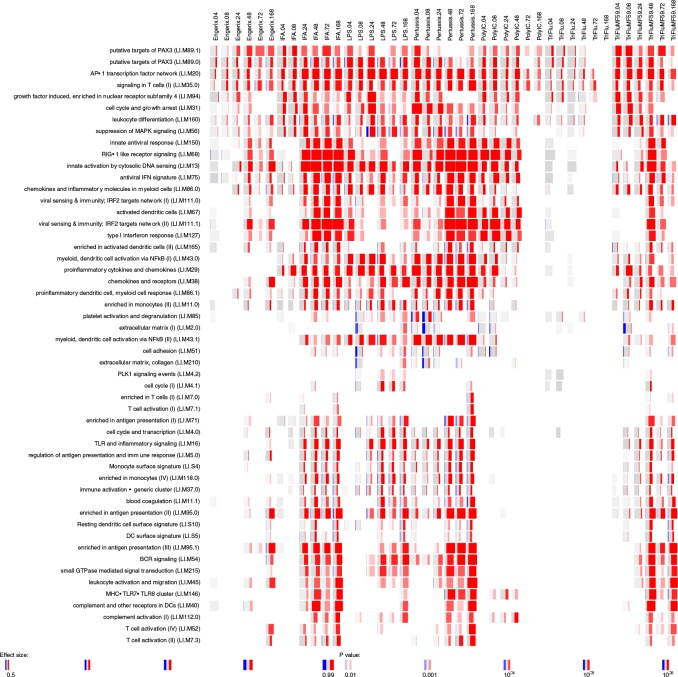
Figure 2—figure supplement 1. Gene-set enrichment analysis in the muscle data set.

Figure 2—figure supplement 1.

Enrichment scores were calculated for blood transcriptional modules defined by Li et al. (2014) using R package tmod (version 0.34) (US National Library of Medicine, 2004). The modules (in rows) are described by the titles followed by the original IDs. Each column corresponds to a different vaccine, TLR agonist or adjuvant and a different time point. The size of each miniature graphic shows how strong the enrichment is. The intensity of the colours indicates the p-value (stronger colours indicate lower p-values). The amount of colour shows the fraction of genes in each module that are significantly up- (red) or downregulated (blue). Only the modules with a p-value for the enrichment that is lower than 10−6 and an effect size of the gene-set enrichment (area under the curve (AUC)) greater than 0.5 are shown.
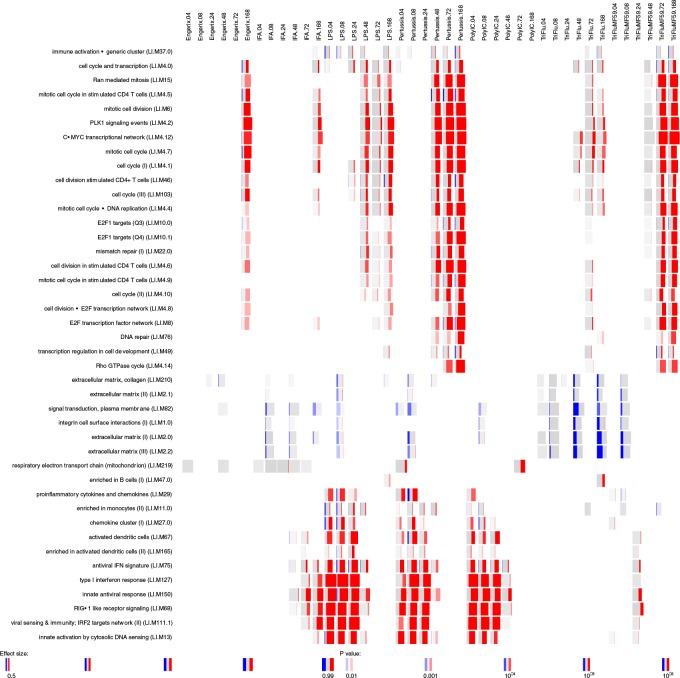
Figure 2—figure supplement 2. Gene-set enrichment analysis in the draining lymph nodes data set.

Figure 2—figure supplement 2.

Enrichment scores were calculated for blood transcriptional modules defined by Li et al. (2014) using R package tmod (version 0.34) (US National Library of Medicine, 2004). The modules (in rows) are described by the titles followed by the original IDs. Each column corresponds to a different vaccine, TLR agonist or adjuvant and a different time point. The size of each miniature graphic shows how strong the enrichment is. The intensity of the colours indicates the p-value (stronger colours indicate lower p-value). The amount of colour shows the fraction of genes in each module that are significantly up- (red) or downregulated (blue). Only the modules with a p-value for the enrichment of <10−6 and an effect size of the gene set enrichment (AUC) >0.5 are shown.
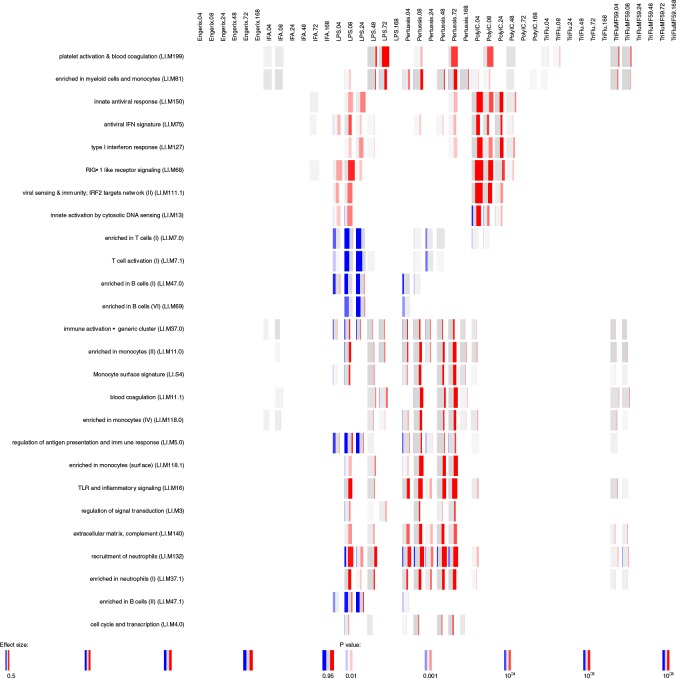
Figure 2—figure supplement 3. Gene-set enrichment analysis in blood data set.

Figure 2—figure supplement 3.

Enrichment scores were calculated for blood transcriptional modules defined by Li et al. (2014) using R package tmod (version 0.34) (US National Library of Medicine, 2004). The modules (in rows) are described by the titles followed by the original IDs. Each column corresponds to a different vaccine, TLR agonist or adjuvant and to a different time point. The size of each miniature graphics shows how strong the enrichment is. The intensity of the colours indicates the p-value (stronger colours lower p-value). The amount of colour shows the fraction of genes in each module that are significantly up- (red) or downregulated (blue). Only the modules with p-value for enrichment of <10−6 and an effect size of for the gene-set enrichment (AUC)of >0.5 are shown.