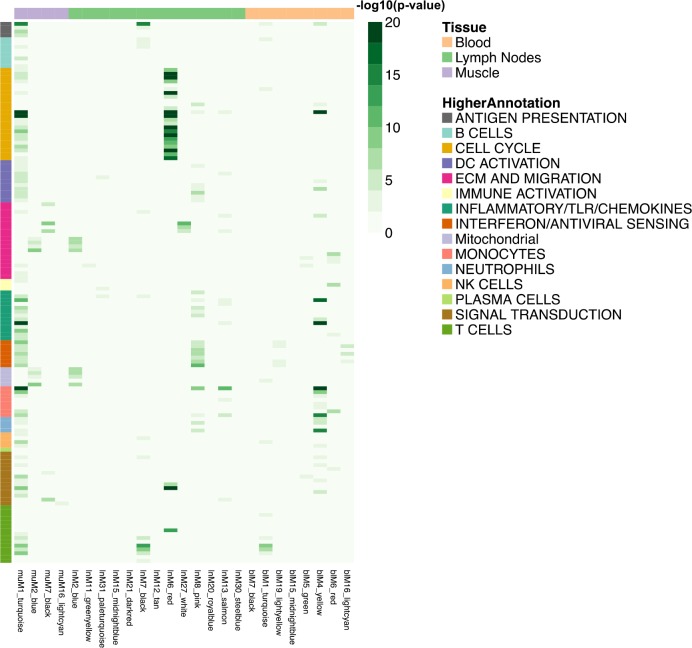
Figure 3. Heatmap representing the transcript overlap between WGCNA modules and the reference modules.
Reference modules are the blood transcriptional modules defined by Li et al. (2014). These modules are shown in rows and are annotated within a higher functional group. Only WGCNA modules that showed a significant enrichment (hypergeometric test adjusted p-value<0.05) in any of the reference modules were included and shown in columns (hypergeometric test adjusted p-value<0.05). The legends on the figure report the strength of the p-value as a gradient of green. The colours at the top of the columnsindicate the tissue being analysed, whereas rows are colour-coded to indicate their higher annotation, as indicated in the key.


