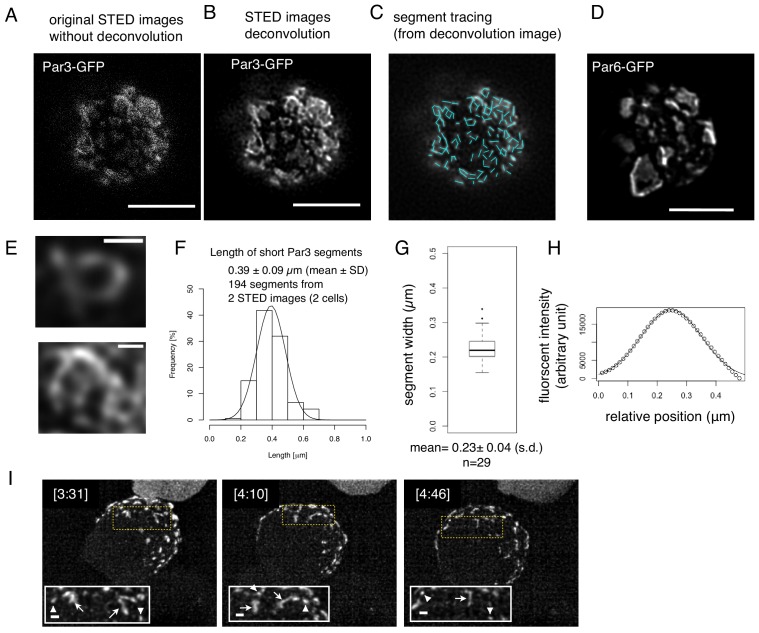
Figure 11. Structual analysis of the assembly state of the Par-complex using STED microscopy.
(A) STED image of a cell that expresses Par3-GFP. The distribution of GFP was detected via indirect immunofluorescence staining. Scale bar, 5 μm for (A–D). (B) Deconvoluted image of the super-resolution (STED) image (A). (C) Tracing of the segments is indicated as light blue straight lines in the deconvoluted STED image (B). See Materials and methods for details. (D) Deconvoluted STED images of cells that expressed Par6-GFP together with pMT-myc-Par3, followed by GFP immunostaining. (E) Magnified views of the cell in (B) visualize the meshwork composed of unit-like segments. Scale bar, 0.5 μm. (F) Distribution of the length of individual segments constructing Par-islands visualized by Par3-GFP and its Gaussian fitting. See Figure 8 for measurements. The mean value of the single segment lengths was 0.39 ± 0.09 (s.d.) μm based on 194 segments from 2 STED images for two cells including (A). (G) Distribution of half widths of segments composing Par-islands that were visualized by GFP staining in the two cells containing the cell shown in (A). The mean is 0.23 ± 0.04 μm (n = 29). (H) An example of Gaussian fitting of the fluorescence intensity distribution across the segment width visualized by immunofluorescence-staining for GFP. The mean half width = 0.23 ± 0.04 (s.d.) μm. (I) Rod and string structures of the Par3-mKate2 appearing in 3D time-lapse images of a cell expressing Par3-mKate2 during the period of Par-dot formation and development. Four time points were selected from Video 2. Scale bar, 2 μm. Insets display the magnification of a part of the image. Arrowheads indicate Par-dots, arrows, rods, and strings. Scale bar, 0.5 μm.

