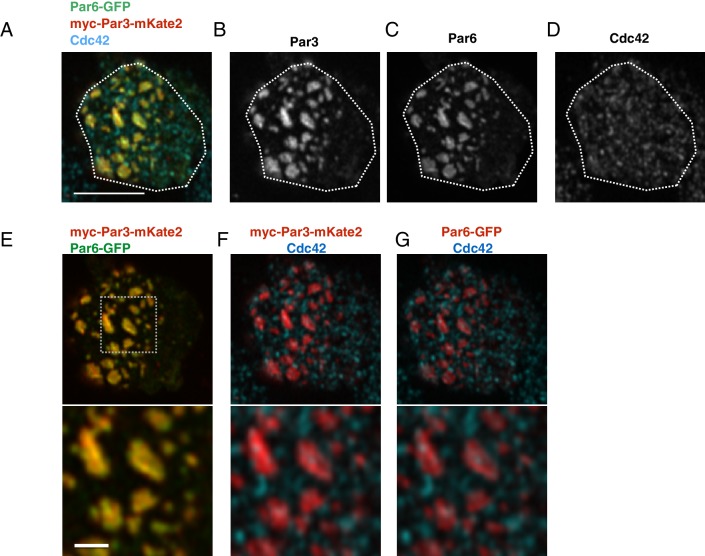
Figure 4. The localization of Par6, Par3 and Cdc42 in the Par-islands.
(A–D) An image of a S2 cell expressing both myc-Par3-mKate2 and Par6-GFP, immunostained for myc, GFP and Cdc42. (A) Triple staining image for myc-Par3-mKate2, Par6-GFP and Cdc42. (B-D) Images showing each single immunostaining. The image was taken by focusing on a surface plane of the cell. Scale bar, 5 µm. (E–G) The double staining image of the cell shown in A-D. (E) myc-Par3-mKates (red) and Par6-GFP (green). (F) The image showing double staining for myc-Par3-mKate2 (red) and Cdc42 (blue). (G). The image showing double staining for Par6-GFP (red) and Cdc42 (blue). Lower panels of E-G show the magnified images of the dotted square. Scale bar, 1 µm. S2 cells are transfected with expression plasmids of actin-promoter-Par6-GFP, actin-promoter-aPKC, and pMT-myc-Par3-mKate2. Two days after transfection, CuSO4 was administrated to induce myc-Par3-mKate2. Three hours post-induction, cells were fixed and immunostained.


