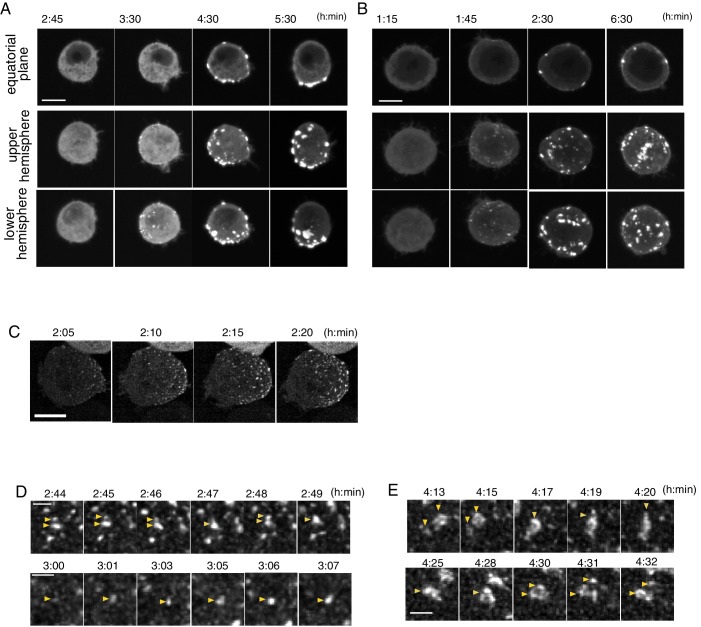
Figure 5. Temporal pattern of Par complex clustering.
(A and B) Time-lapse images of S2 cells inducing Par3-mKate2 expression via the Metallothionein promoter, leading to polarized (A) or non-polarized (B) Par3 distribution. Time 0 (h: min) was at the time of induction by CuSO4 addition in these and subsequent panels. The top row shows images at the equatorial plane. The middle and bottom rows show the max intensity projection images of the upper and lower hemispheres of the cell, respectively. Scale bar, 5 μm. (C) Time-lapse images of Par6-GFP showing the emergence and development of Par-dots. The images are 6 μm max intensity projection covering the entire cell. Scale bar, 5 μm. (D) Time-lapse imaging of Par6-GFP showing the fusion and fission of Par-dots (arrowheads in the upper panel), and the growth of a Par-dot (arrowheads in the lower panel). In E and F, scale bar, 1 μm. (E) Time-lapse image of Par-islands visualized by Par6-GFP. Arrowheads indicate dynamic shape changes, fusion (arrowheads, upper panel) and the dissociation of Par-islands (arrowheads, lower panel).

