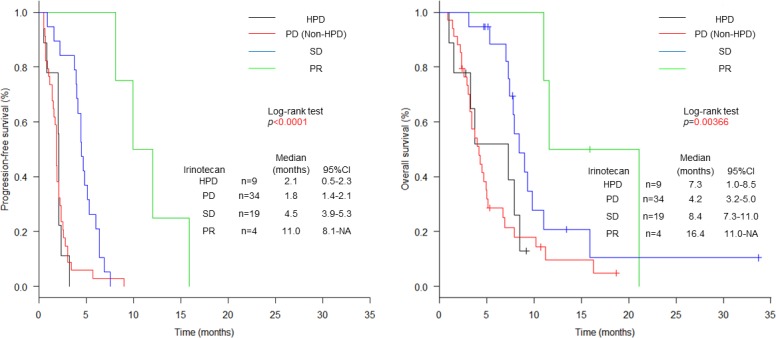
Figure 4.

Kaplan-Meier plots for progression-free survival (PFS) and overall survival (OS). Black lines indicate patients with HPD, red lines indicate patients with PD other than HPD, blue lines indicate patients with SD and green lines indicate patients with PR. PFS and OS curves after initiation of irinotecan treatment according to HPD, PD, SD and PR. HPD, hyperprogressive disease; PD, progressive disease; PR, partial response; SD, stable disease.
