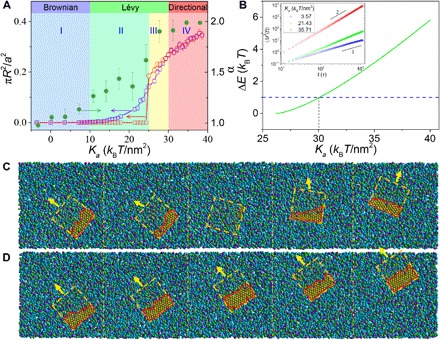
Fig. 5. Correlation between diffusive dynamics and membrane-pore states elucidates the mechanisms of Lévy walk and directional motion of sandwiched GO.

(A) The area ratio between pore and GO and the diffusion exponent, α, as a function of Ka. The red and blue curves depict the cases of the most probable pore area and the averaged pore area, respectively. The shaded regions divide four regimes of the membrane-pore states, where the colors correspond to those adopted in Fig. 3 (B to E). (B) The energy barrier in the ER-R curve, ΔE (Fig. 4B), as a function of Ka. The dashed blue line plots the thermal energy, 1 kBT. Inset: Time-averaged mean square displacement 〈Δr2(t)〉 as a function of lag time on log-log scales for various Ka, where the slopes give α. (C and D) Successive stages of a sandwiched GO exhibiting Lévy walk at χGT = 10.01 (Ka = 25.29 kBT/nm2) (C) and directional motion at χGT = 14.3 (Ka = 34.74 kBT/nm2) (D). The dashed squares mark the contour of GO, the red outlines display the pore induced by the sandwiched GO, and the arrows denote the moving direction of the GO. The times of the simulation snapshots are (from left to right) 22,160 τ, 22,240 τ, 22,480 τ, 22,800 τ, and 23,040 τ for (C) and 22,320 τ, 22,360 τ, 22,400 τ, 22,440 τ, and 22,480 τ for (D).
