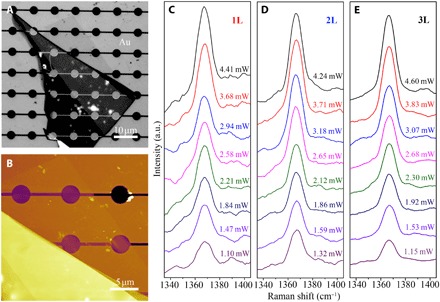
Fig. 2. Laser power effect.

Optical (A) and AFM (B) images of a 1L BN on Au/Si. The Raman G bands of the suspended (C) 1L BN, (D) 2L BN, and (E) 3L BN under different laser power. a.u., arbitrary units.

Optical (A) and AFM (B) images of a 1L BN on Au/Si. The Raman G bands of the suspended (C) 1L BN, (D) 2L BN, and (E) 3L BN under different laser power. a.u., arbitrary units.