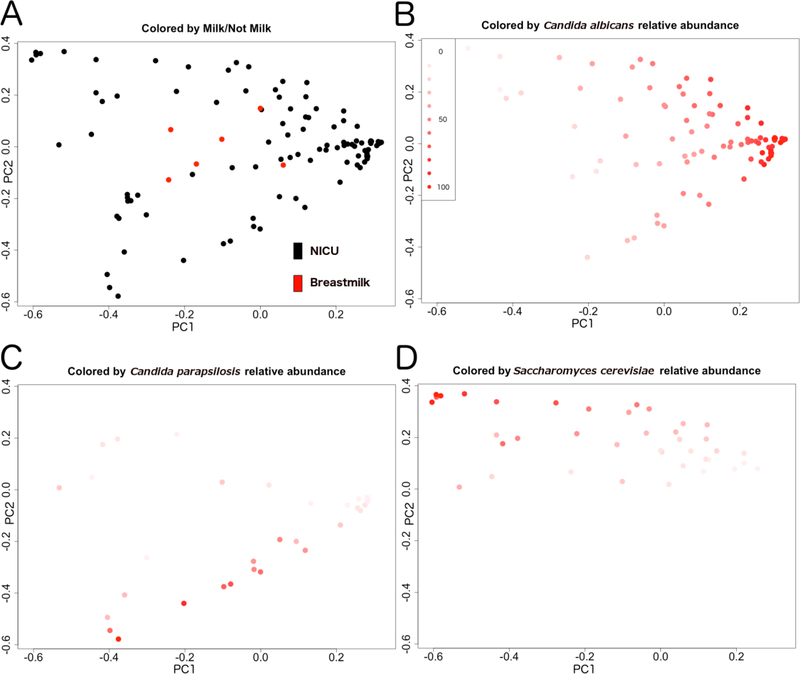
Figure 5.
Beta-diversity comparisons of fungal communities. PCoA of Bray-Curtis distances for (A) breastmilk (red dots) and NICU surface (black dots) samples. (B-D) Each sample (dot) is colored based on relative abundances of Candida albicans (B), Candida parapsilosis (C), and Saccharomyces cerevisiae (D), with darkest red indicating highest relative abundance values and lightest red representing lowest relative abundance, as indicated in the common heatmap shown in panel B. The proportion of variance explained by each principal coordinate (all plots) is 30.6 for PC1 and 17.0 for PC2.

