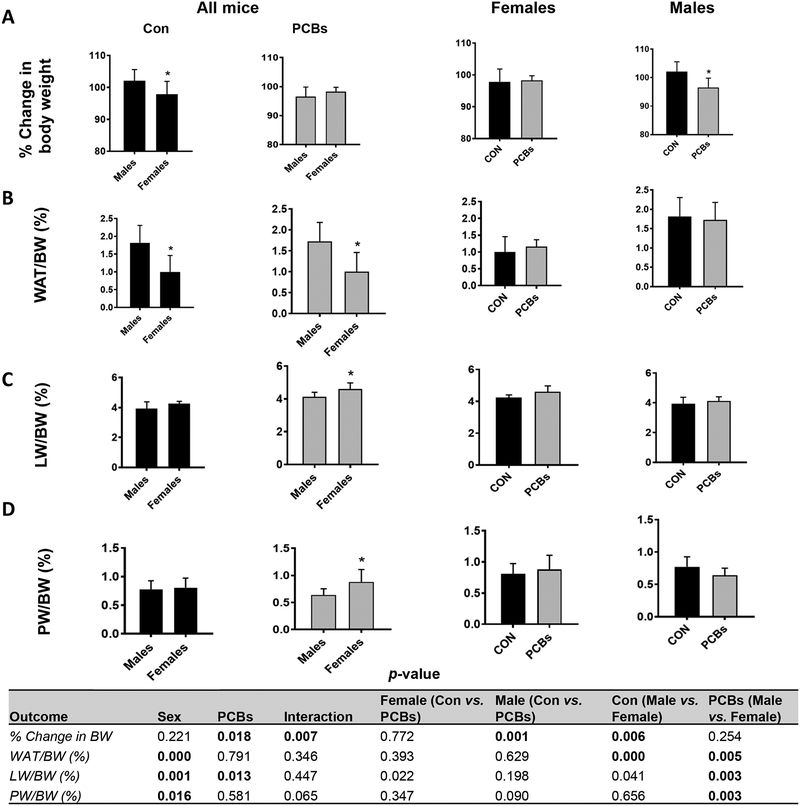
Figure 1. PCB effects on body weight and fat composition.
(A) Body weight was measured throughout the two week study period and the percent increase or decrease in body weight relative to the initial body weight taken at the beginning of the study (considered as 100%) was calculated. (B) The body fat composition was measured by calculating the white adipose tissue weight to body weight ratio. (C & D) The liver and pancreas were isolated, weighed and their respective weights relative to body weight were calculated for each mouse. Values are mean ± SD. Values for p <0.05 are in bold.

