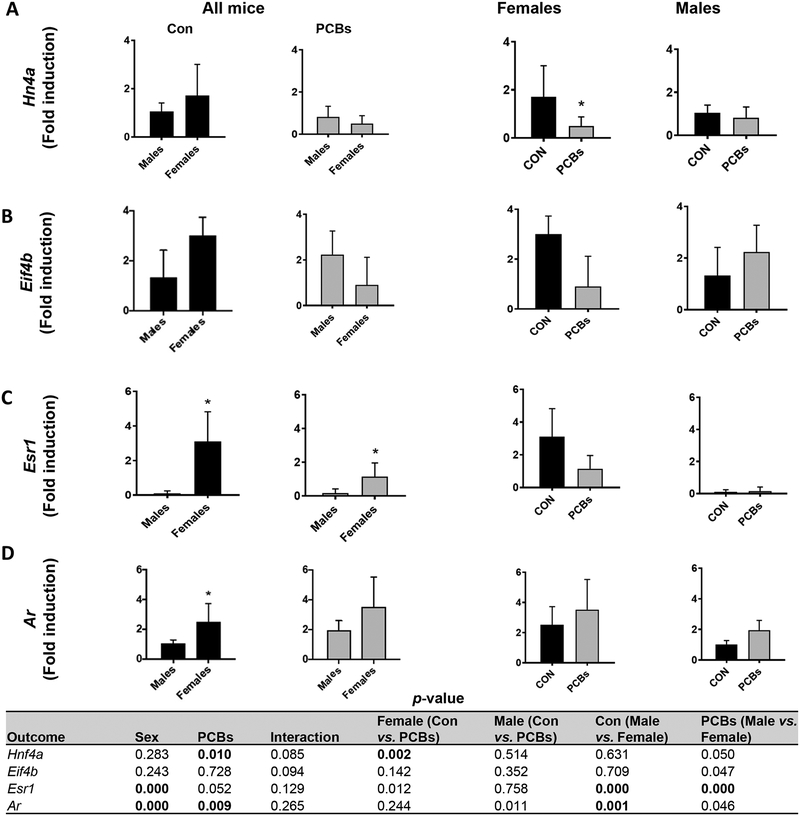
Figure 5. Sex-dependent, PCB effects on the EGFR.
(A) Hepatic mRNA expression for Egfr was measured. (B) Western blot was performed on liver protein to measure total and phosphorylated EGFR levels. (C) The densitometry ratios of total EGFR to the corresponding control protein, Actin and (D) phosphorylated to total EGFR were calculated. Values are mean ± SD. Values for p <0.05 are in bold.

