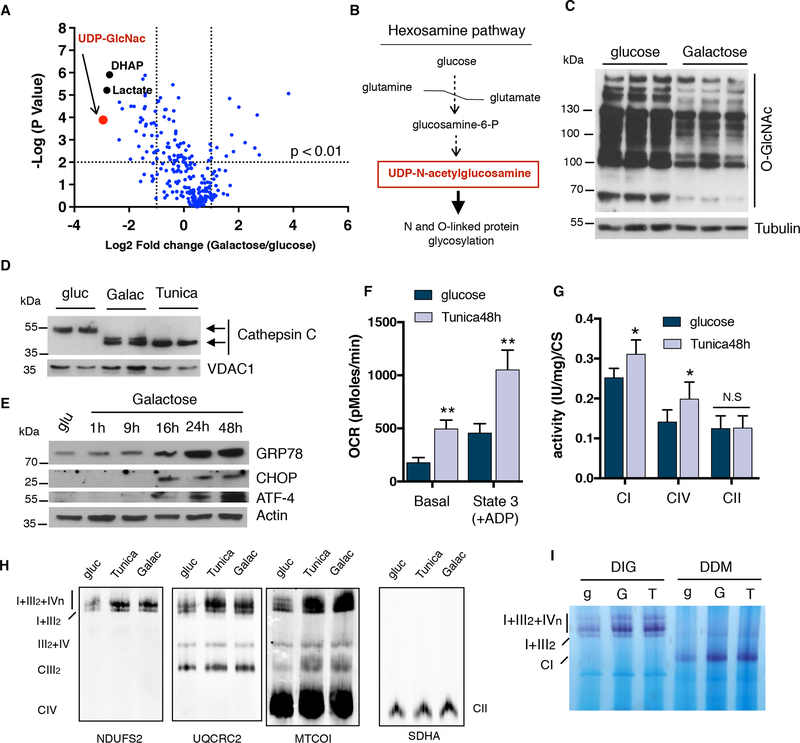
Figure 2: ER stress induction leads to an increase in OXPHOS performance.
(A) Volcano plot of global metabolomics analysis comparing galactose vs glucose-grown cells. The most down-regulated metabolite, UDP-N-acetylgucosamine, is highlighted in red. (B) Simplification of the hexosamine pathway. (C) Immunoblot showing total O-linked glycosylation in cells cultured either in glucose or galactose. (D) Immunoblots showing a shift in migration of Cathepsin C due to impaired ER protein glycosylation in U2OS cells. (E) Western blot analysis of ER stress markers: GRP78/BiP, CHOP and ATF4 in U2OS cells cultured in galactose at the indicated time points. (F) Oxygen consumption rates, (G) mitochondrial enzymatic activities of CI, CIV and CII normalized to CS and (H) SC levels in isolated mitochondria from tunicamycin treated cells after 48 hours. (I) Complex I in-gel activity of digitonin (DIG) or DDM-solubilized mitochondria from glucose, galactose and tunicamycin treated cells. SDHA was used as a loading control. Immunoblots shown are representative of >3 independent experiments and all other experiments are represented as mean ± s.e.m., n>3. Asterisks denote *p<0.05 or **p<0.01. For two comparisons a two-tailed t-test was used, for multiple comparisons, one-way ANOVA with Bonferroni post-test was applied. gluc/g, glucose. Galac/G, galactose. Tunica/T, tunicamycin. UDP-GlcNac, UDP-N-acetetylglucosamine. DHAP, dihydroxyacetone-phosphate.

