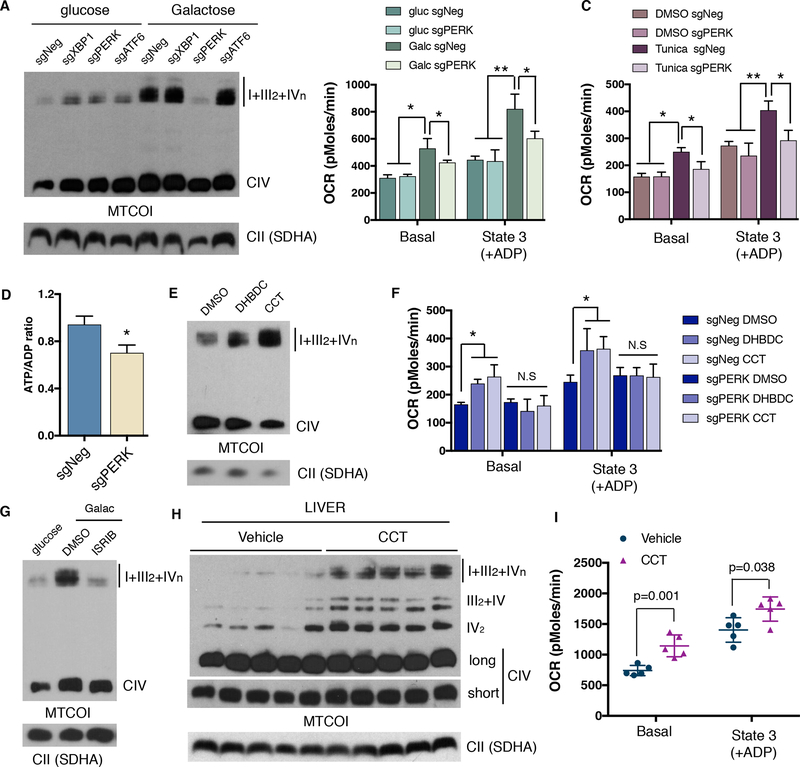
Figure 3: PERK increases mitochondrial respiration and electron transport chain supercomplexes in vitro and in vivo.
(A) BNGE analysis of CRISPR mediated ablation of ER stress effectors XBP1, PERK and ATF6. (B-C) Oxygen consumption rates of isolated mitochondria from PERK depleted cells cultured in glucose or galactose (B) or treated with tunicamycin (C) for 24h. (D) ATP/ADP ratio of PERK KO (sgPERK) and negative control (sgNeg) cells after 48 hours in galactose. (E) BNGE immunoblot of SC levels in cells treated with PERK activators DHBDC or CCT020312 for 72h. (F) Mitochondrial respiration of mitochondria isolated from control cells or PERK deficient cells after treatment with PERK activators for 72h. (G) BNGE immunoblot after inhibition of eIF2α phosphorylation with ISRIB. (H) SC levels assessed by BNGE and (I) oxygen consumption measurements of isolated mitochondria from mouse livers 4 days post CCT020312 injections. Immunoblots shown are representative of >3 independent experiments using CII (anti-SDHA) as a loading control. All other experiments are represented as mean ± s.e.m., n>3. Asterisks denote *p<0.05 or **p<0.01. For two comparisons a two-tailed t-test was used, for multiple comparisons, one-way ANOVA with Bonferroni post-test was applied. gluc, glucose. Galac, galactose. Tunica, tunicamycin. CCT, CCT020312.

